You can monitor a CTERA Edge Filer using a Datadog agent running on a Windows PC.
The following describes how to monitor a CTERA Edge Filer upload queue.
Requirements
- CTools is a CTERA toolbox to check, manage, and run bulk operations, and automate tasks across multiple CTERA Edge Filers and Portals. CTools is available from github: https://github.com/ctera/ctools/releases.
- PowerShell on a Windows PC.
- The Datadog agent installed on the Windows PC, as described in https://docs.datadoghq.com/agent/basic_agent_usage/windows/?tab=standardinstallation.
- Run the following command:
Start-Process -Wait msiexec -ArgumentList '/qn /i datadog-agent-7-latest.amd64.msi APIKEY="<apikey>" SITE="datadoghq.com" HOSTNAME="<hostname>"'
where:
SITE is the website (some licenses default to EU).
hostname is the host to show in Datadog. If this is not configured, it should use the hostname of the datadog-agent machine.
apikey is the appropriate APIKEY.
- Run the following command:
Monitoring an Edge Filer
To monitor and edge filer:
- Move ctools.exe to
C:\Users\<Username>\Documents\PowerShell
where Username is your user name. For example,C:\Users\Administrator.WINSERVER22\Documents\PowerShell. - Create the following script in PowerShell:
# Get the folder location for this script $scriptDir = Split-Path -Parent $MyInvocation.MyCommand.Definition # 1) Generate a CSV $ctoolsPath = Join-Path $scriptDir "ctools.exe" $outputCsv = Join-Path $scriptDir "output.csv" & $ctoolsPath show_status portal.ctera.me admin ctera321 $outputCsv all_tenants False # 2) Parse the CSV and build JSON objects mapping the required fields $results = Import-Csv -Path $outputCsv | ForEach-Object { # Extract CPU and Mem from "CPU: 0% Mem: 15%" string if ($_.'Current Performance' -match 'CPU:\s*(\d+%)\s+Mem:\s*(\d+%)') { $cpu = $matches[1] $mem = $matches[2] } else { $cpu = "" $mem = "" } # Add the timestamp first [ordered]@{ timestamp = (Get-Date -Format "o") filerName = $_.'Filer Name' FilesUploading = [int] $_.'uploadingFiles' CloudSyncStatus = $_.'CloudSync Status' ADDomainStatus = $_.'AD Domain Status' CPU = $cpu Mem = $mem } } # 3) Define the log file path relative to the script directory $logFile = Join-Path $scriptDir "cloudsync_monitor.log" # 4) Remove the previous log file if it exists if (Test-Path $logFile) { Remove-Item $logFile } # 5) Write each JSON object to the log foreach ($record in $results) { $jsonLine = $record | ConvertTo-Json -Compress -Depth 10 Add-Content -Path $logFile -Value $jsonLine } # 6) Set permissions to allow read access to all users $acl = Get-Acl $logFile $accessRule = New-Object System.Security.AccessControl.FileSystemAccessRule("Everyone", "Read", "Allow") $acl.AddAccessRule($accessRule) Set-Acl -Path $logFile -AclObject $acl - Save the script as
cloudsync_monitor.ps1inC:\Users\<Username>\Documents\PowerShell
where Username is your user name. For example,C:\Users\Administrator.WINSERVER22\Documents\PowerShell.NoteYou can test the script in PowerShell by running the following command:
& "$env:USERPROFILE\Documents\PowerShell\cloudsync_monitor.ps1" - Check cloudsync_monitor.log to ensure it is logging expected information, including filerName, FilesUploading, and ADDomainStatus.
- Configure logging in the Datadog agent.
- Modify the
C:\ProgramData\Datadog\datadog.yamlfile by adding or uncommentinglogs_enabledand setting the value totrue. - Restart the Datadog agent service using the following command:
restart-service datadogagent -Forceand run the following to ensure that logging is enabled:agent status | findstr -i "logs" - Add a logs configuration file:
- Create a folder:
mkdir "C:\ProgramData\Datadog\conf.d\cloudsync_monitor_powershell.d\" - Create and edit the logs configuration file:
notepad C:\ProgramData\Datadog\conf.d\cloudsync_monitor_powershell.d\conf.yaml - Populate the file with the following:
where path is the full path to the folder and Username is your user name. For example,logs: - type: file path: <Username>\cloudsync_monitor.log service: cloudsync_monitor_powershell source: powershellC:\Users\Administrator.WINSERVER22\Documents\PowerShell
- Create a folder:
- Modify the
- Access the Datadog user interface and add a log source.
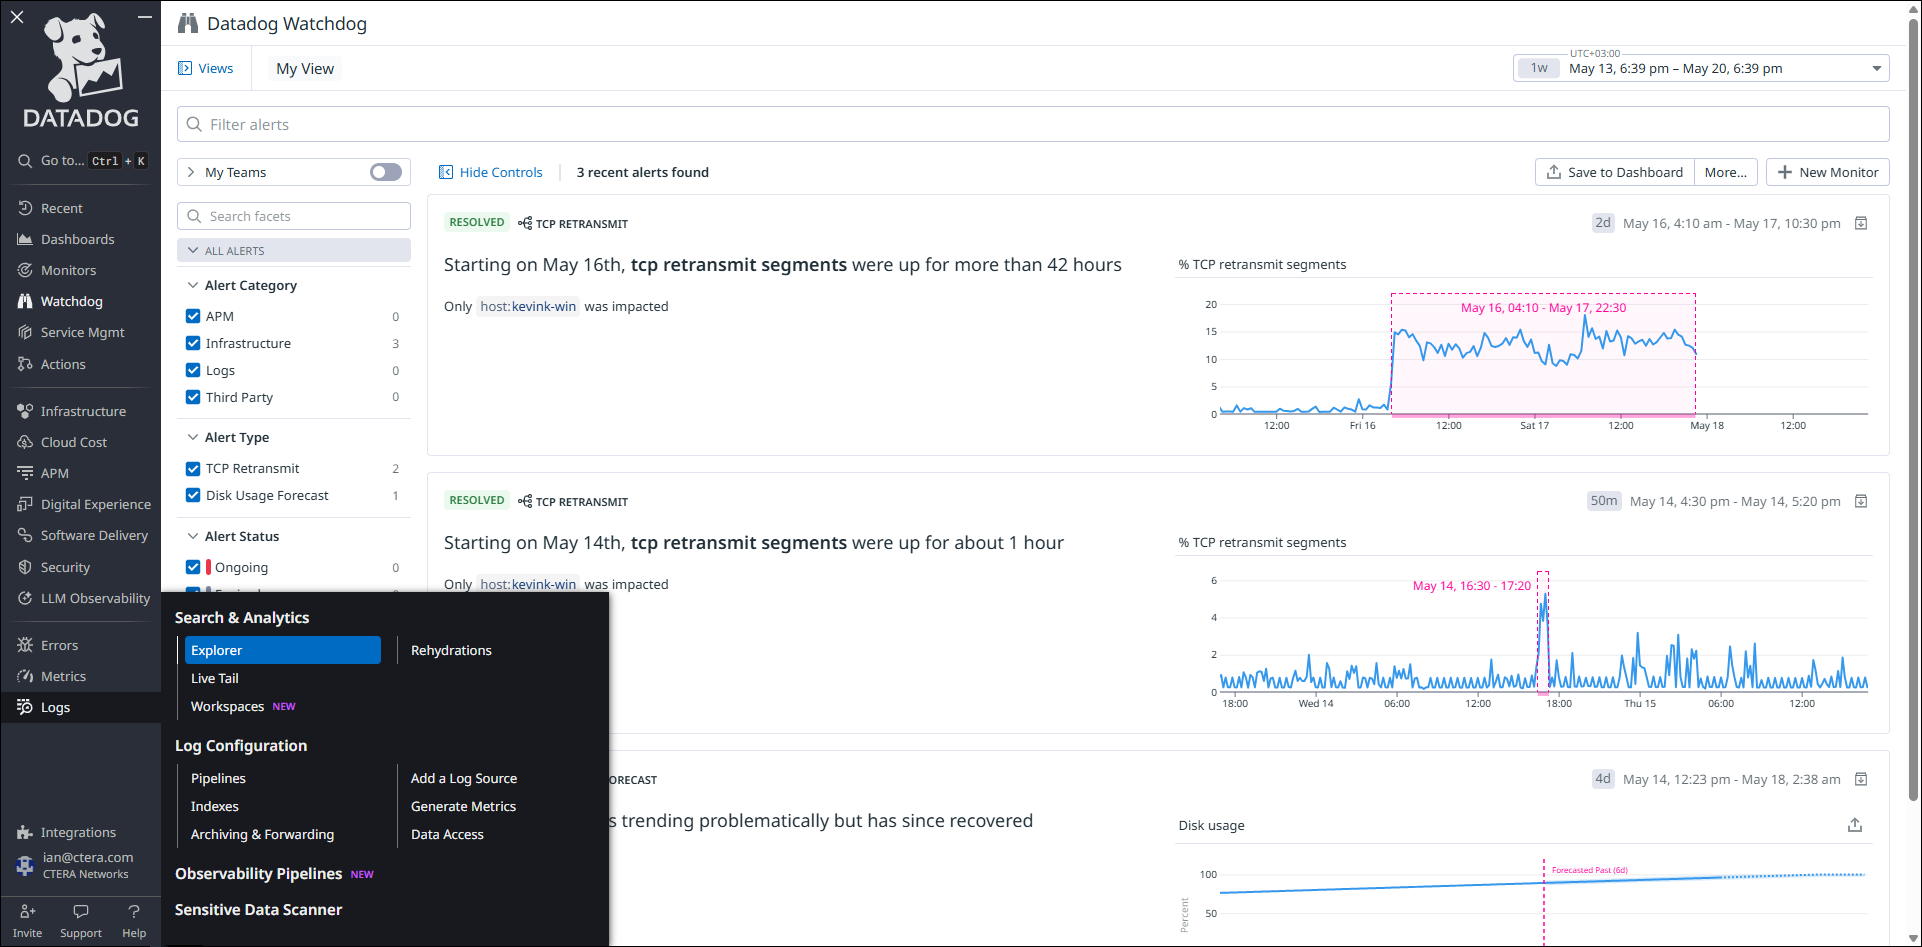
- Hover over Logs and click Add a log source.
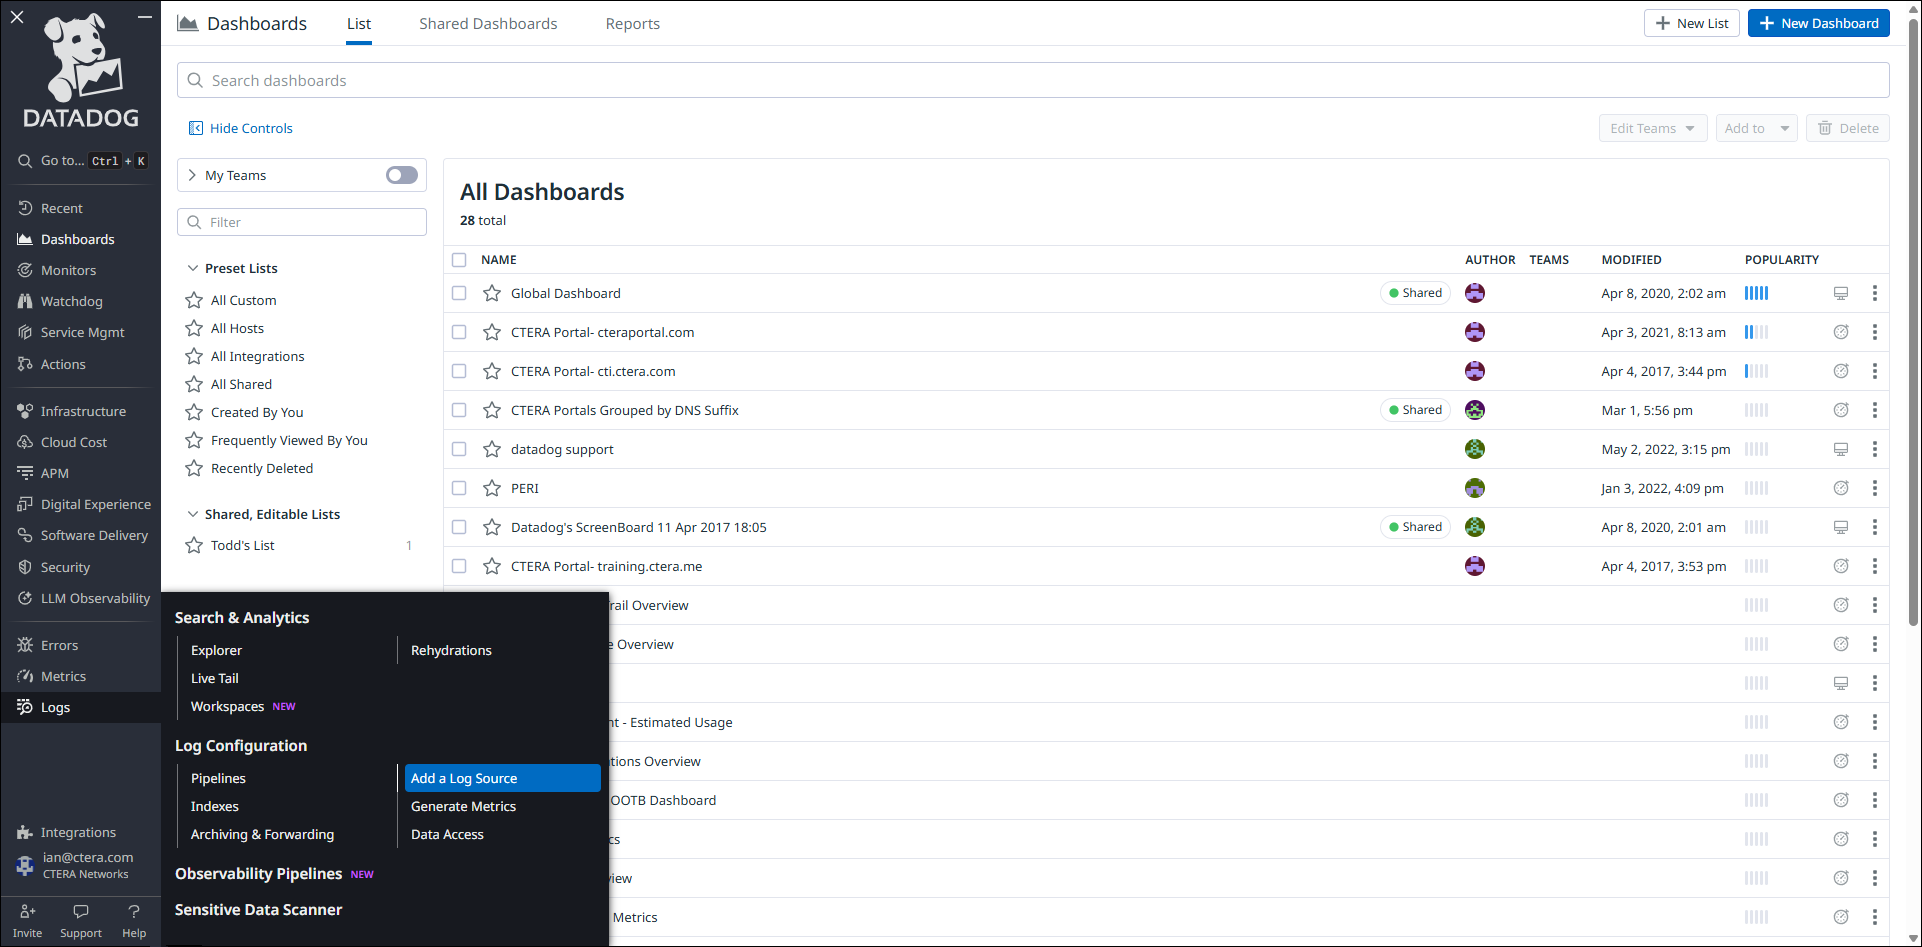
- Select Server > Custom Files.
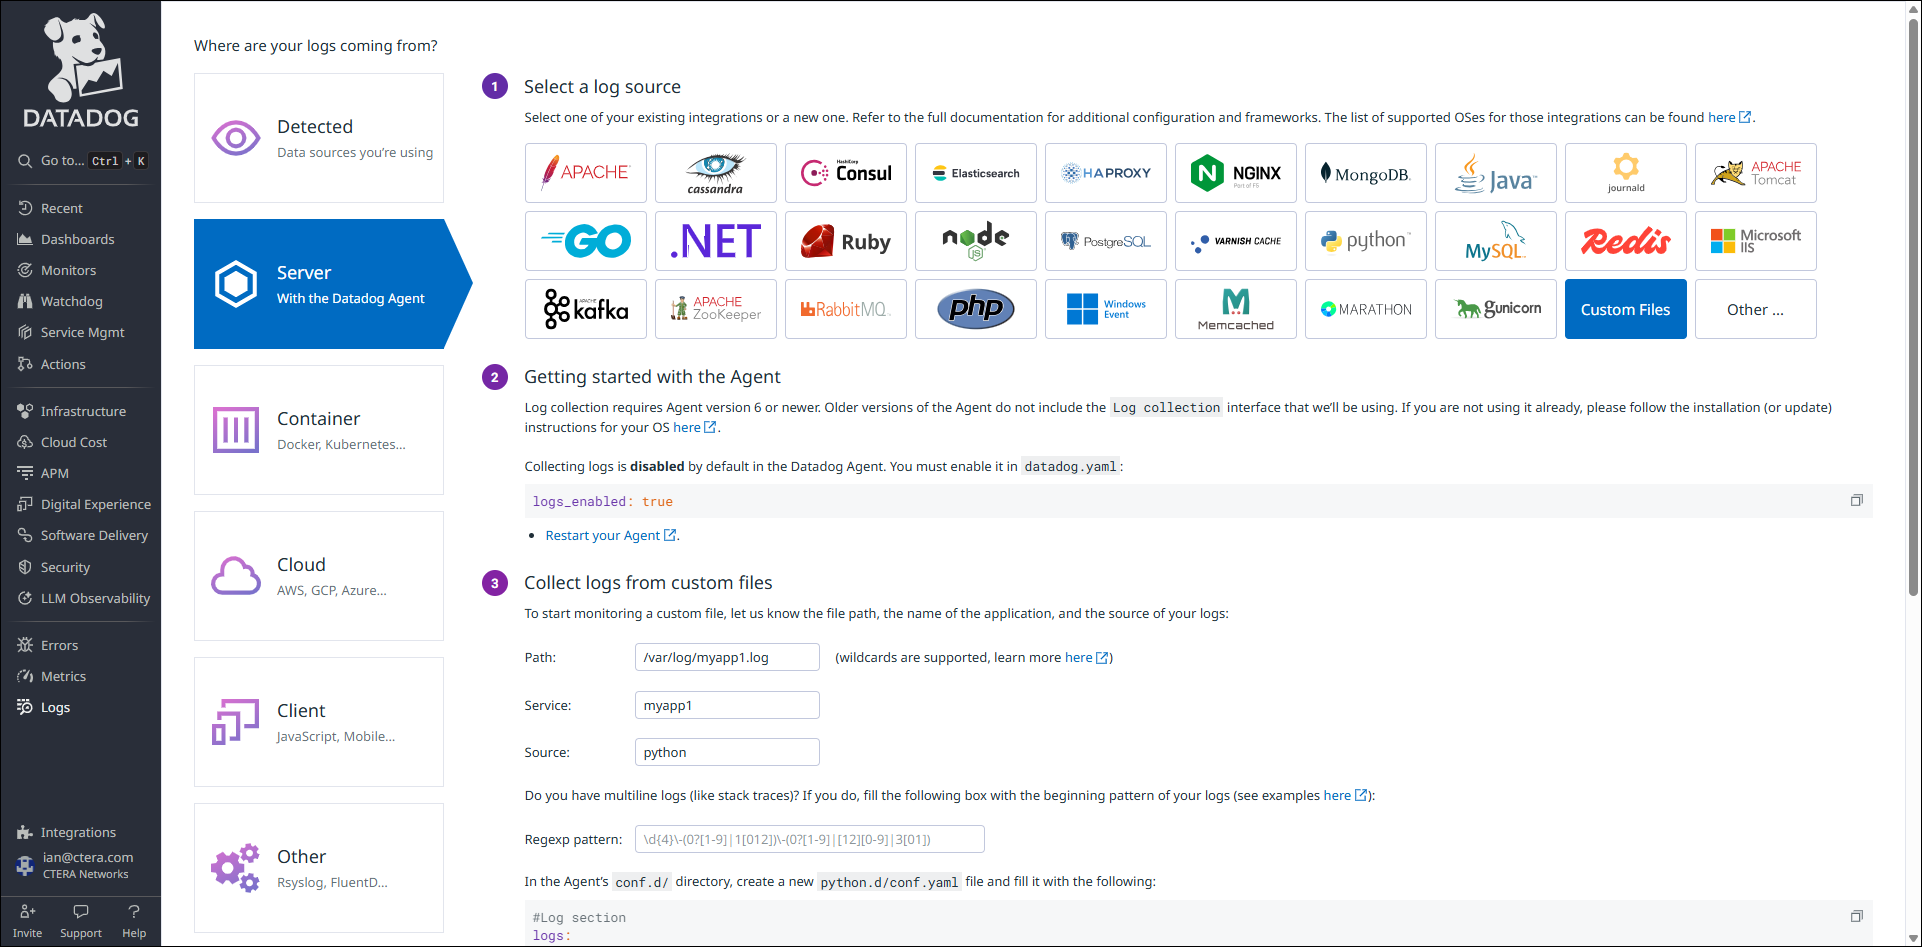
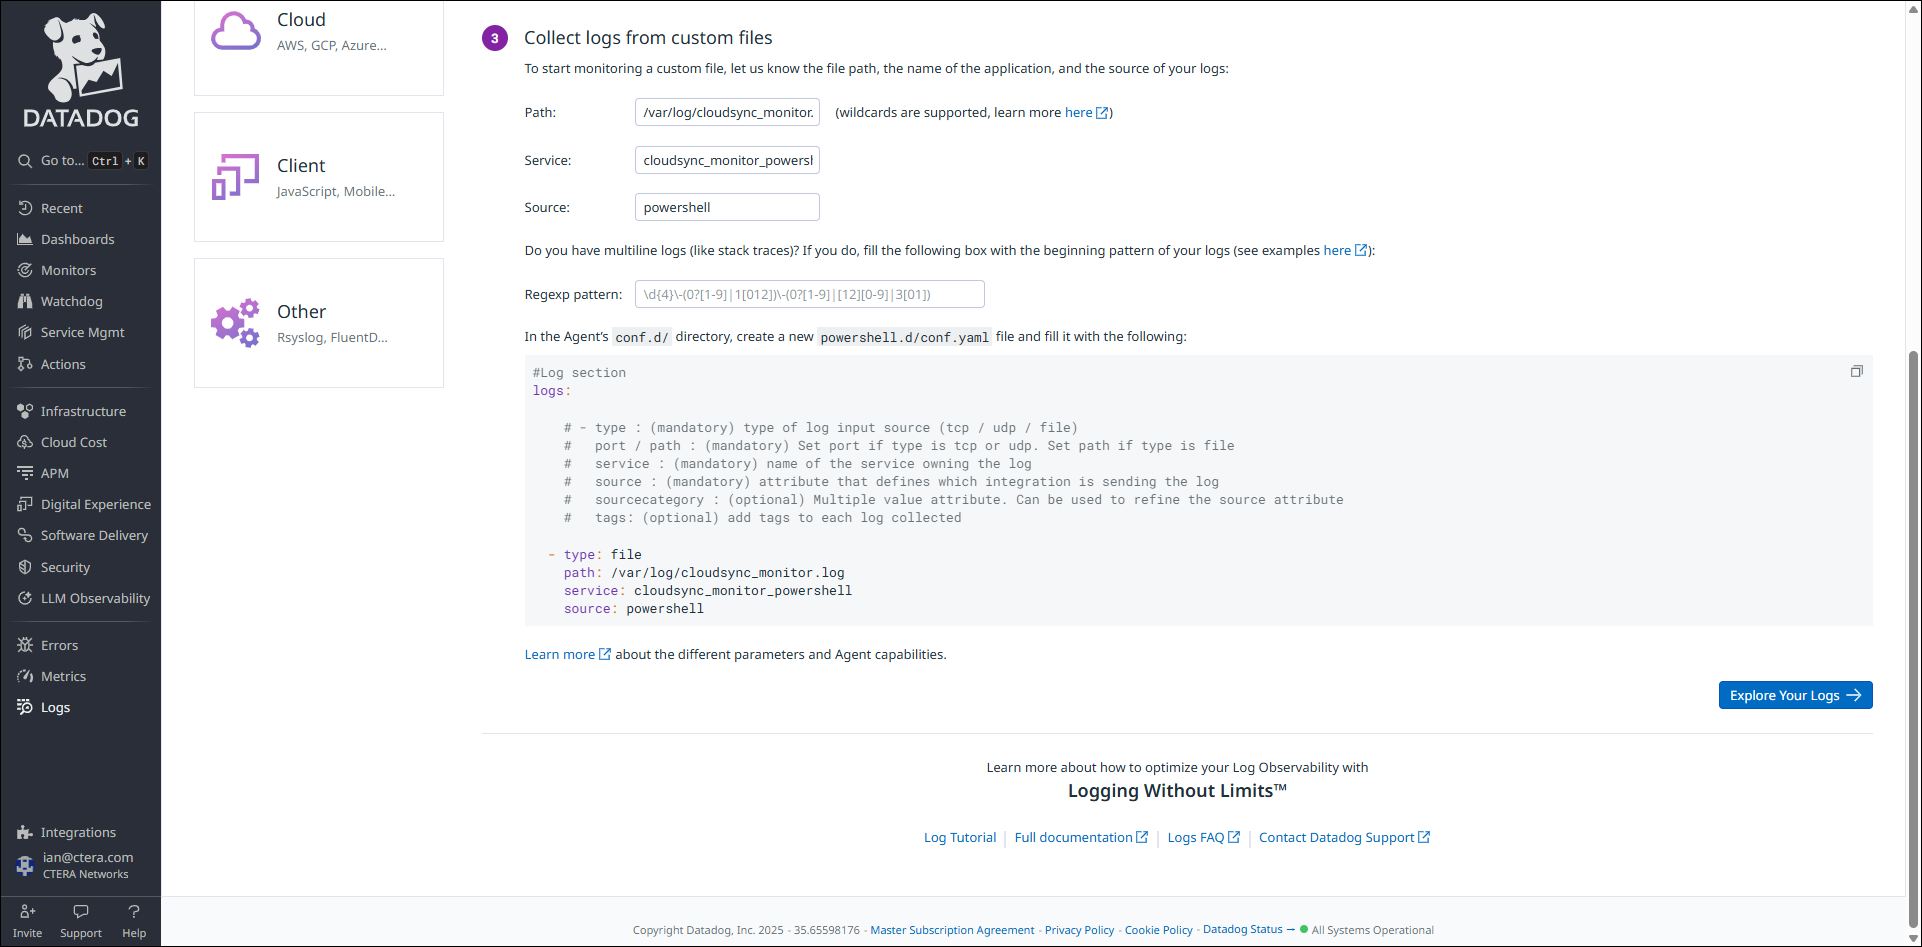
- Populate as follows:
Path –/var/log/cloudsync_monitor.log
Service –cloudsync_monitor_powershell
source –powershell - Save by clicking Explore your logs.
- Hover over Logs and click Add a log source.
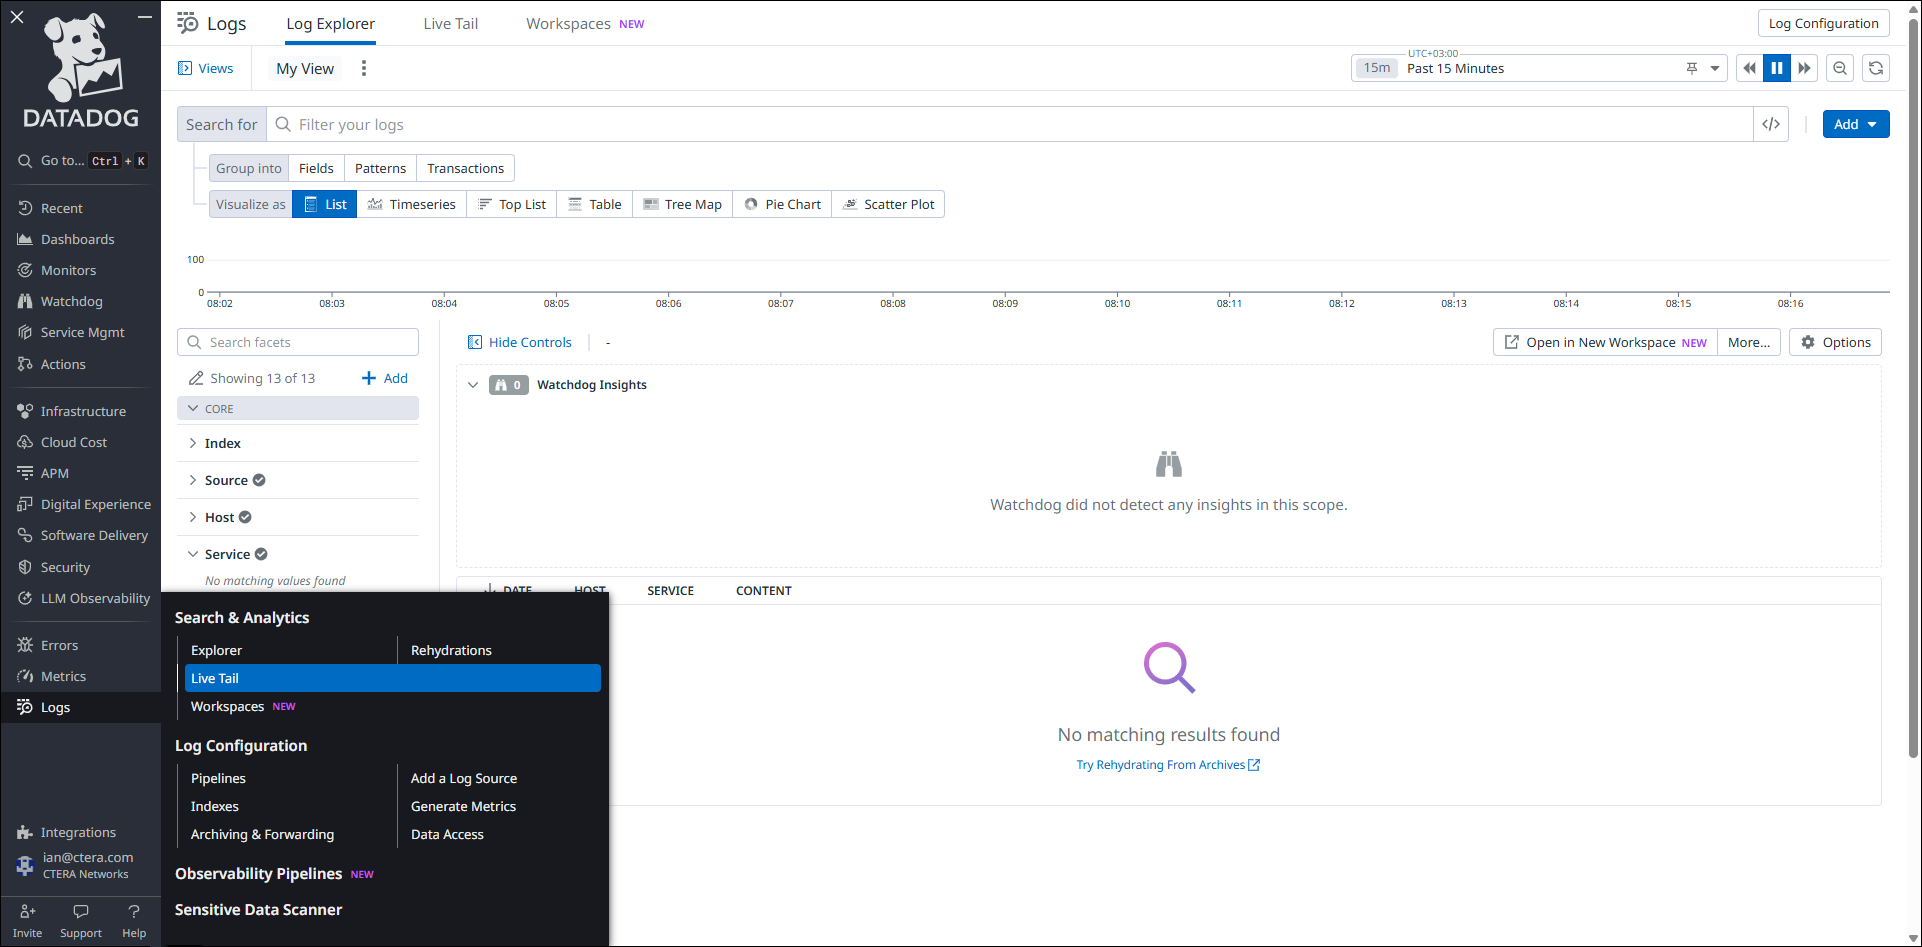
- Verify that logs entries are being written by running the following script:
& "$env:USERPROFILE\Documents\PowerShell\cloudsync_monitor.ps1"and in the Datadog user interface hover over Logs and click Live Tail.
- In the Datadog user interface, create Measures (FilesUploading) and Facets (ADDomainStatus):
- Hover over Logs and click Explorer.
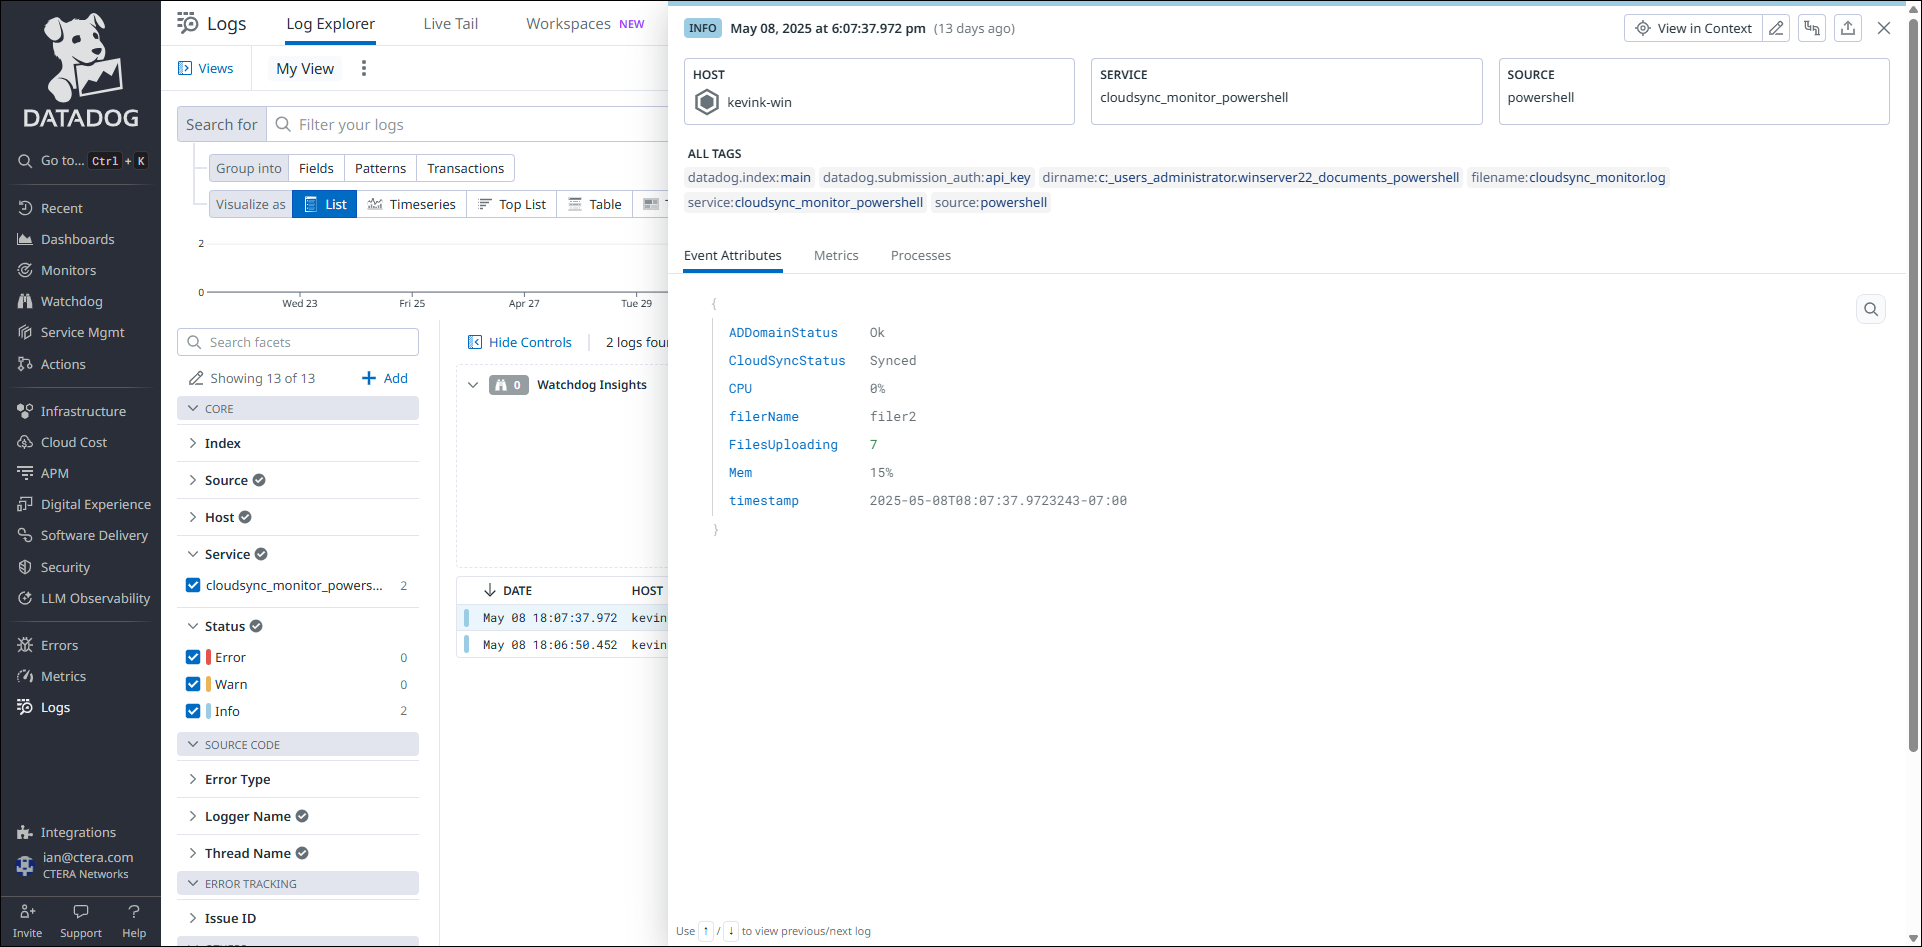
- Click on a log event.
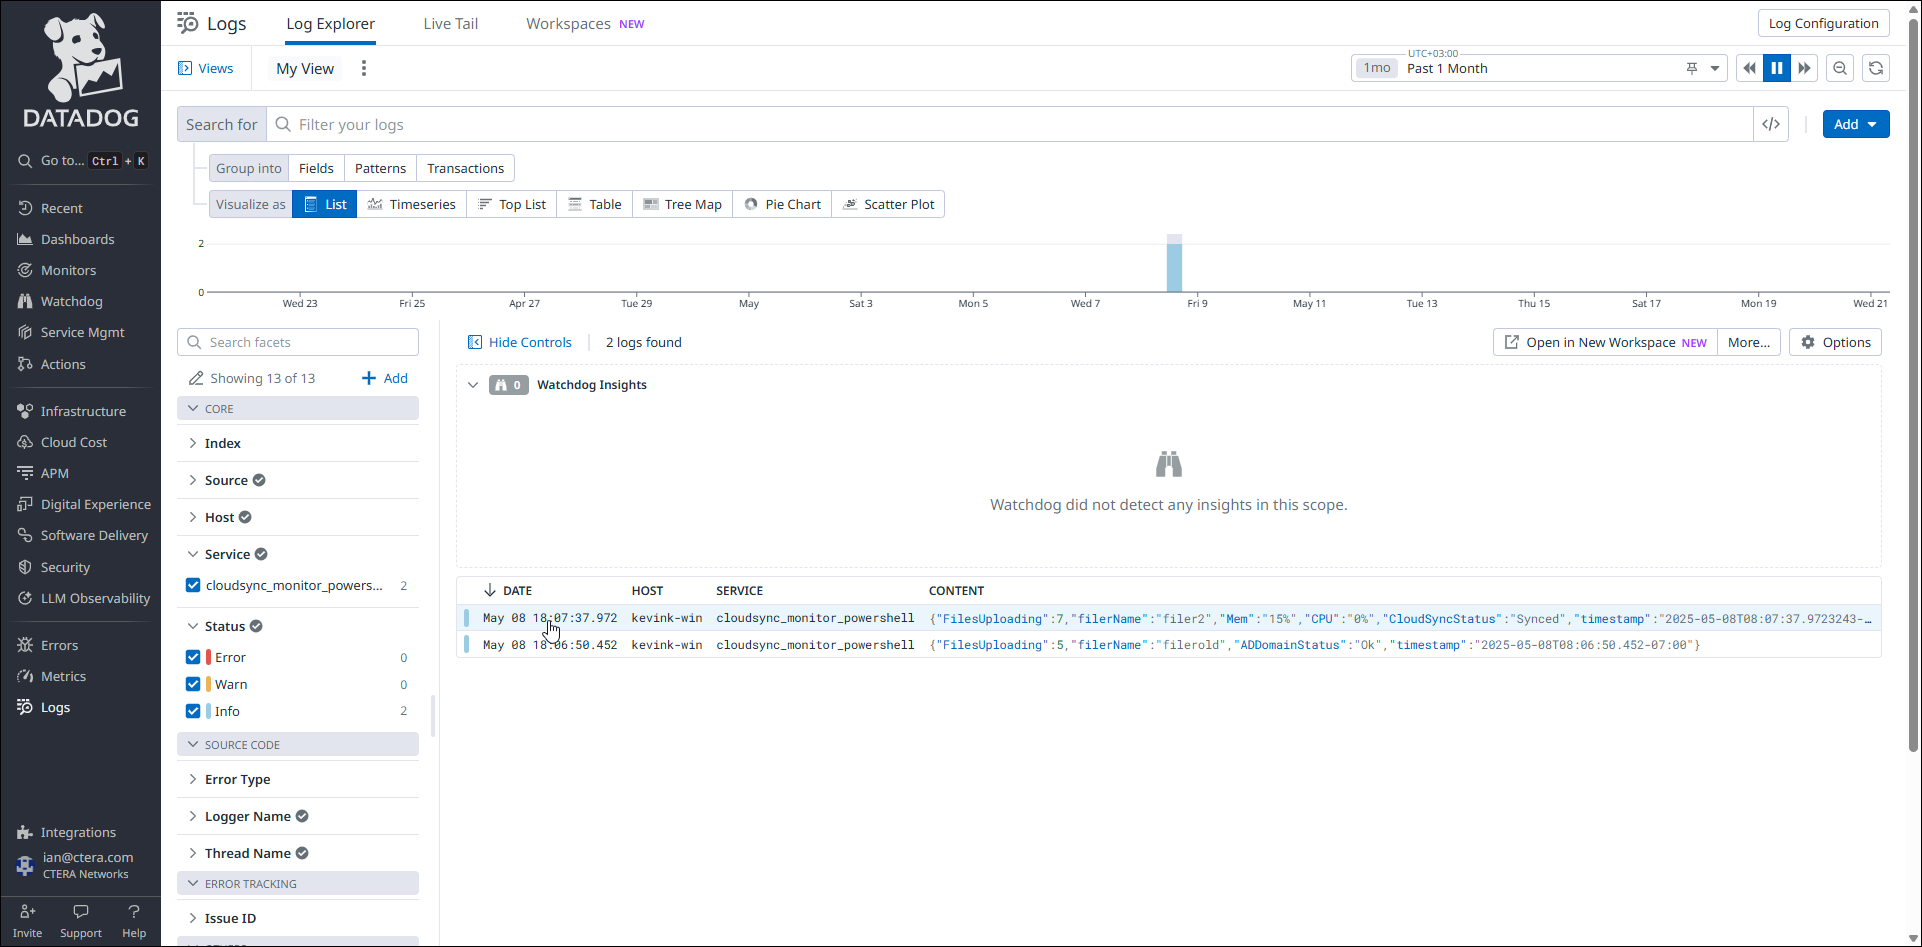
The event details are displayed.
- Click
FilesUploading
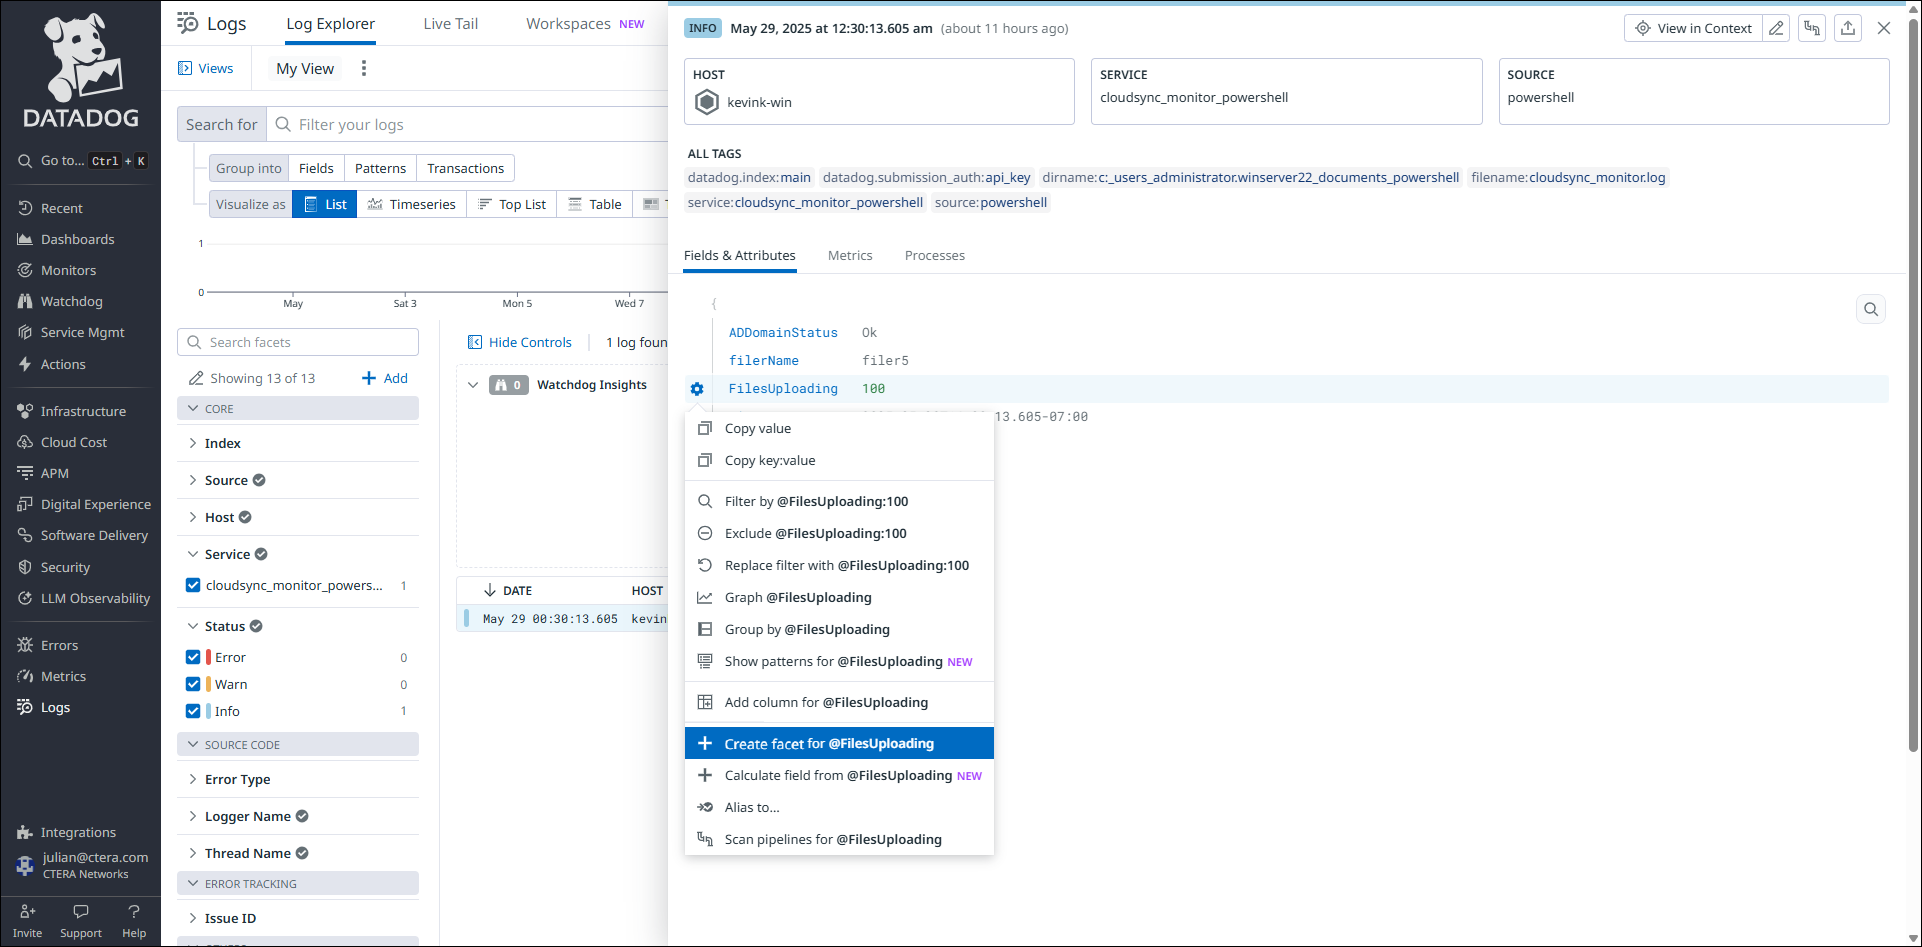
- In the event details, click Create facet for @FilesUploading, select the Measure tab and click Add.
- Click
ADDomainStatusin the event details, and then click Create facet for @ADDomainStatus, select the Measure tab and click Add.
- Hover over Logs and click Explorer.
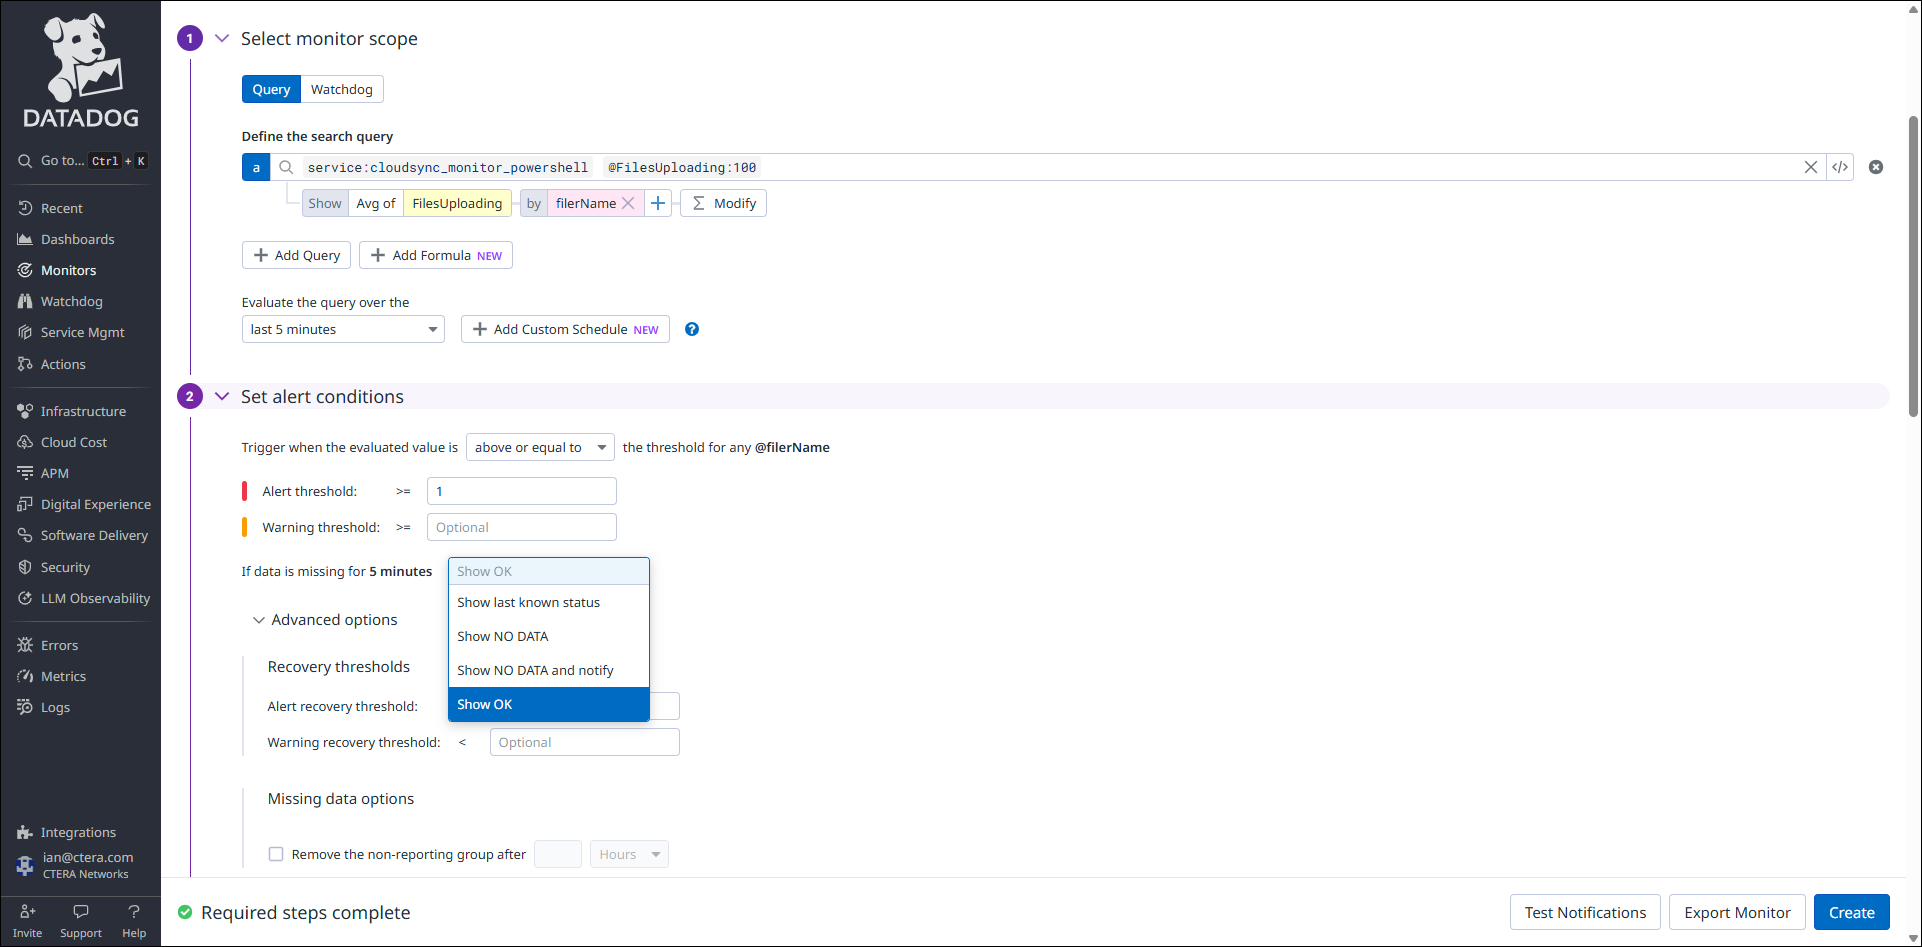
- In the Datadog user interface, create the monitor for the upload count.
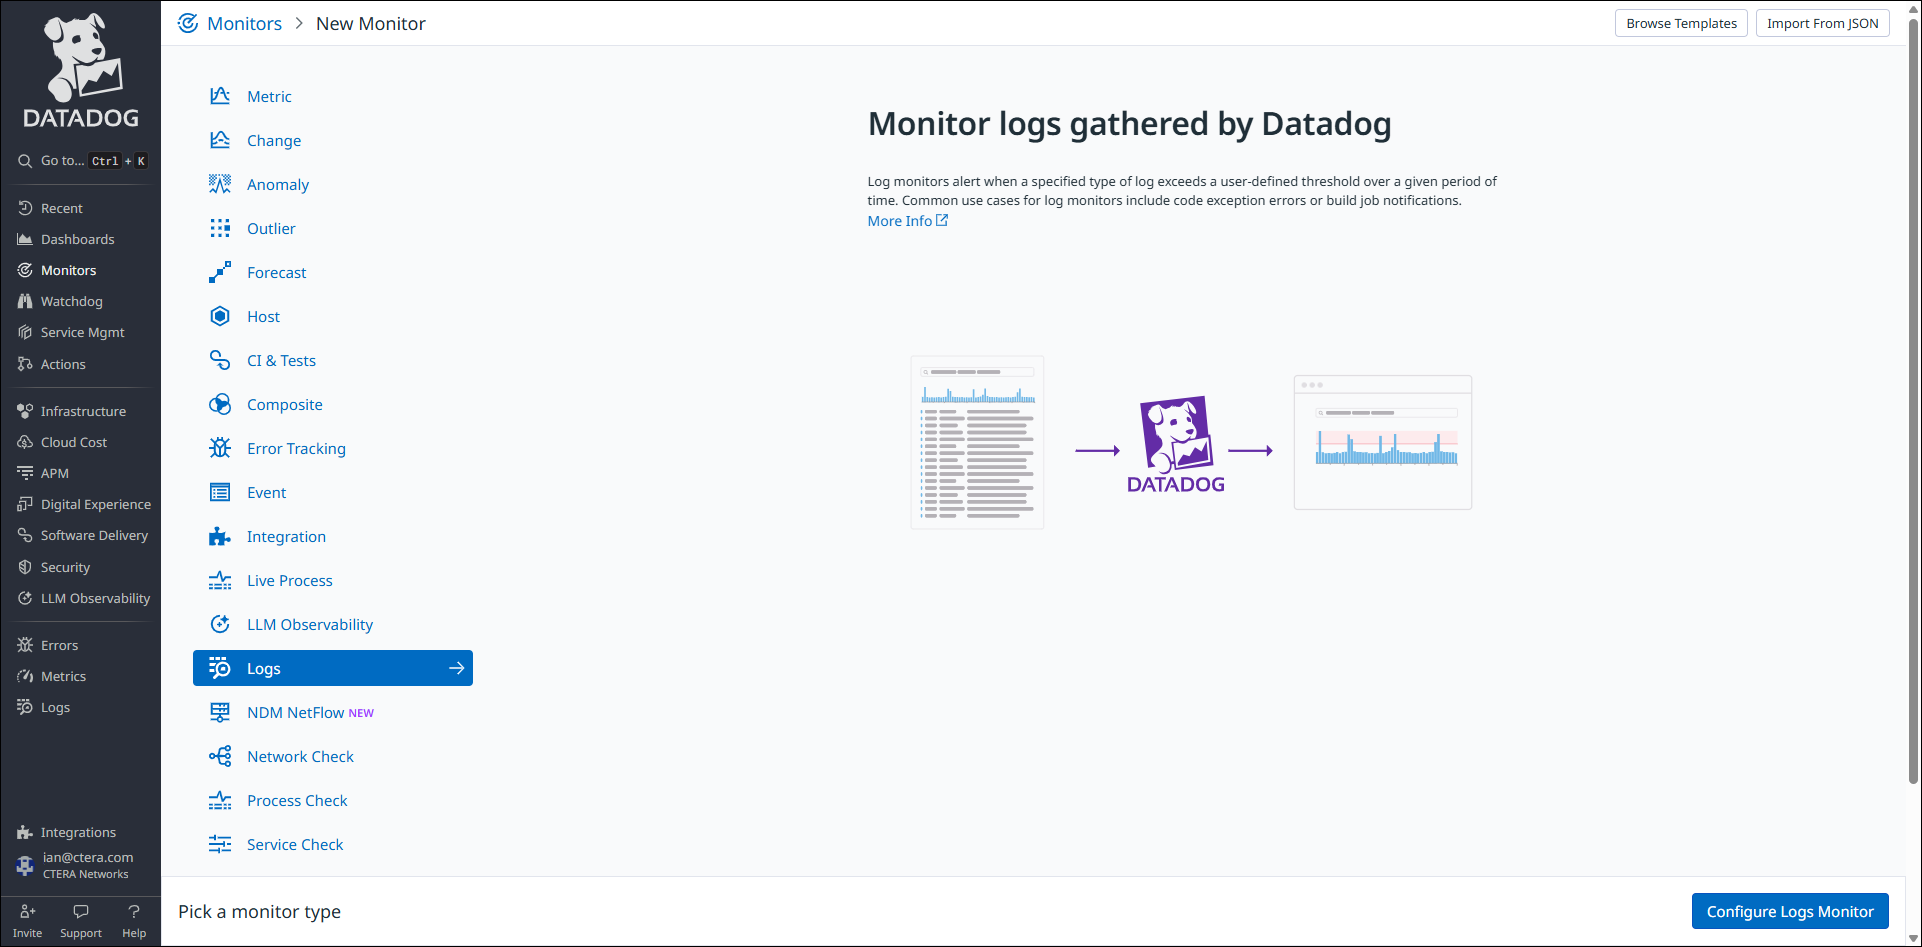
- Navigate to Monitors > New Monitor.
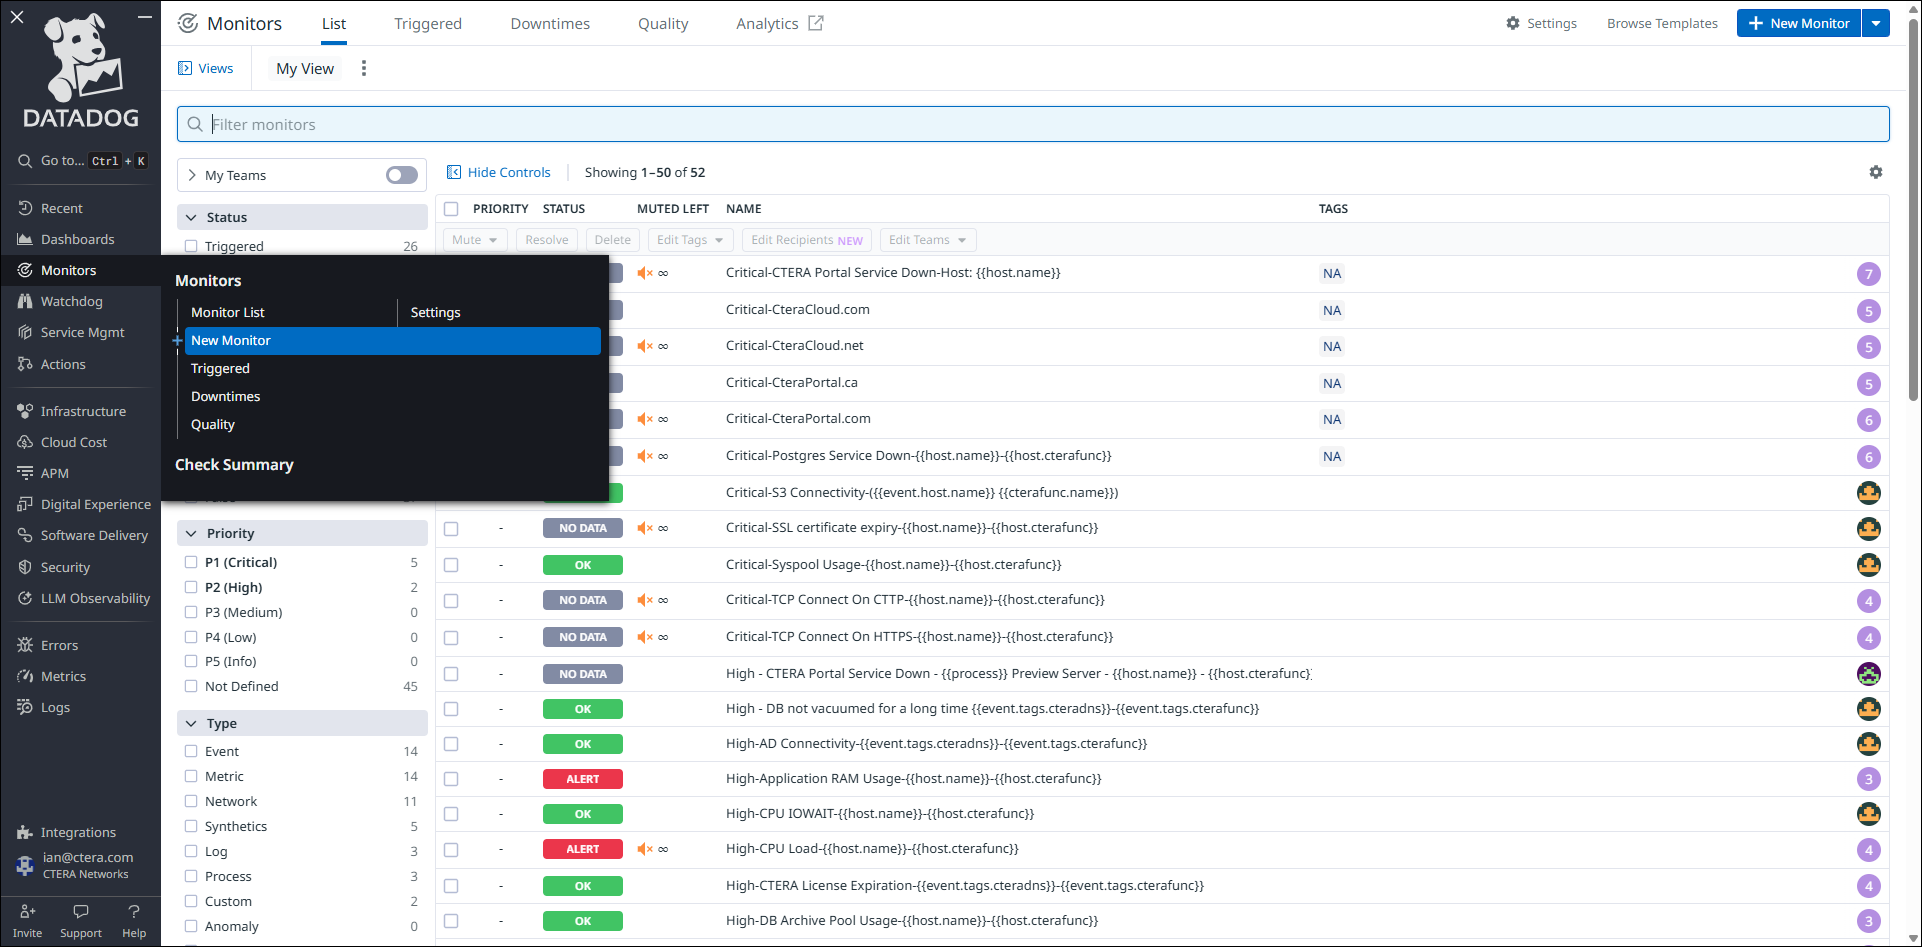
- Click Logs.
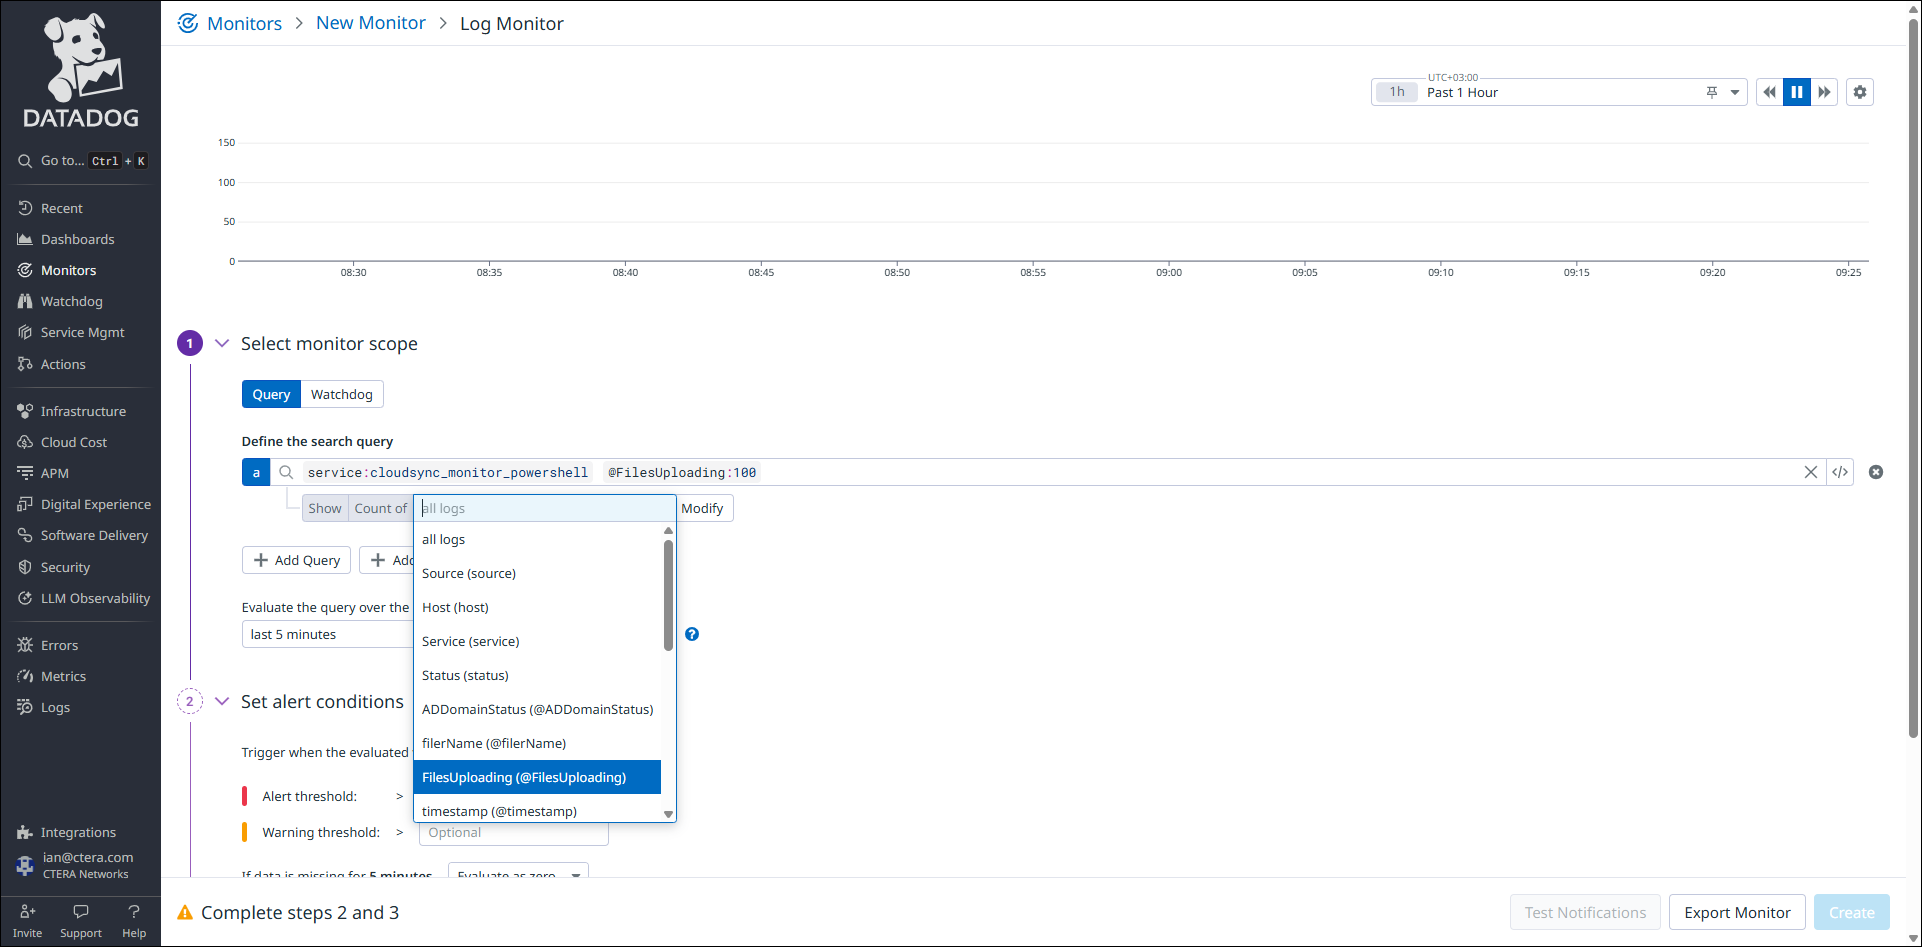
- Add the following search query:
service:cloudsync_monitor_powershell @FilesUploading:<n>
where n is the number of files you want monitored. - Click all logs and select
FilesUploading (@FilesUploading)from the drop-down menu.
- Click Everything and select
filerName (@filerName)from the drop-down menu. - In the Set alert conditions section set the trigger to
above or equal to.
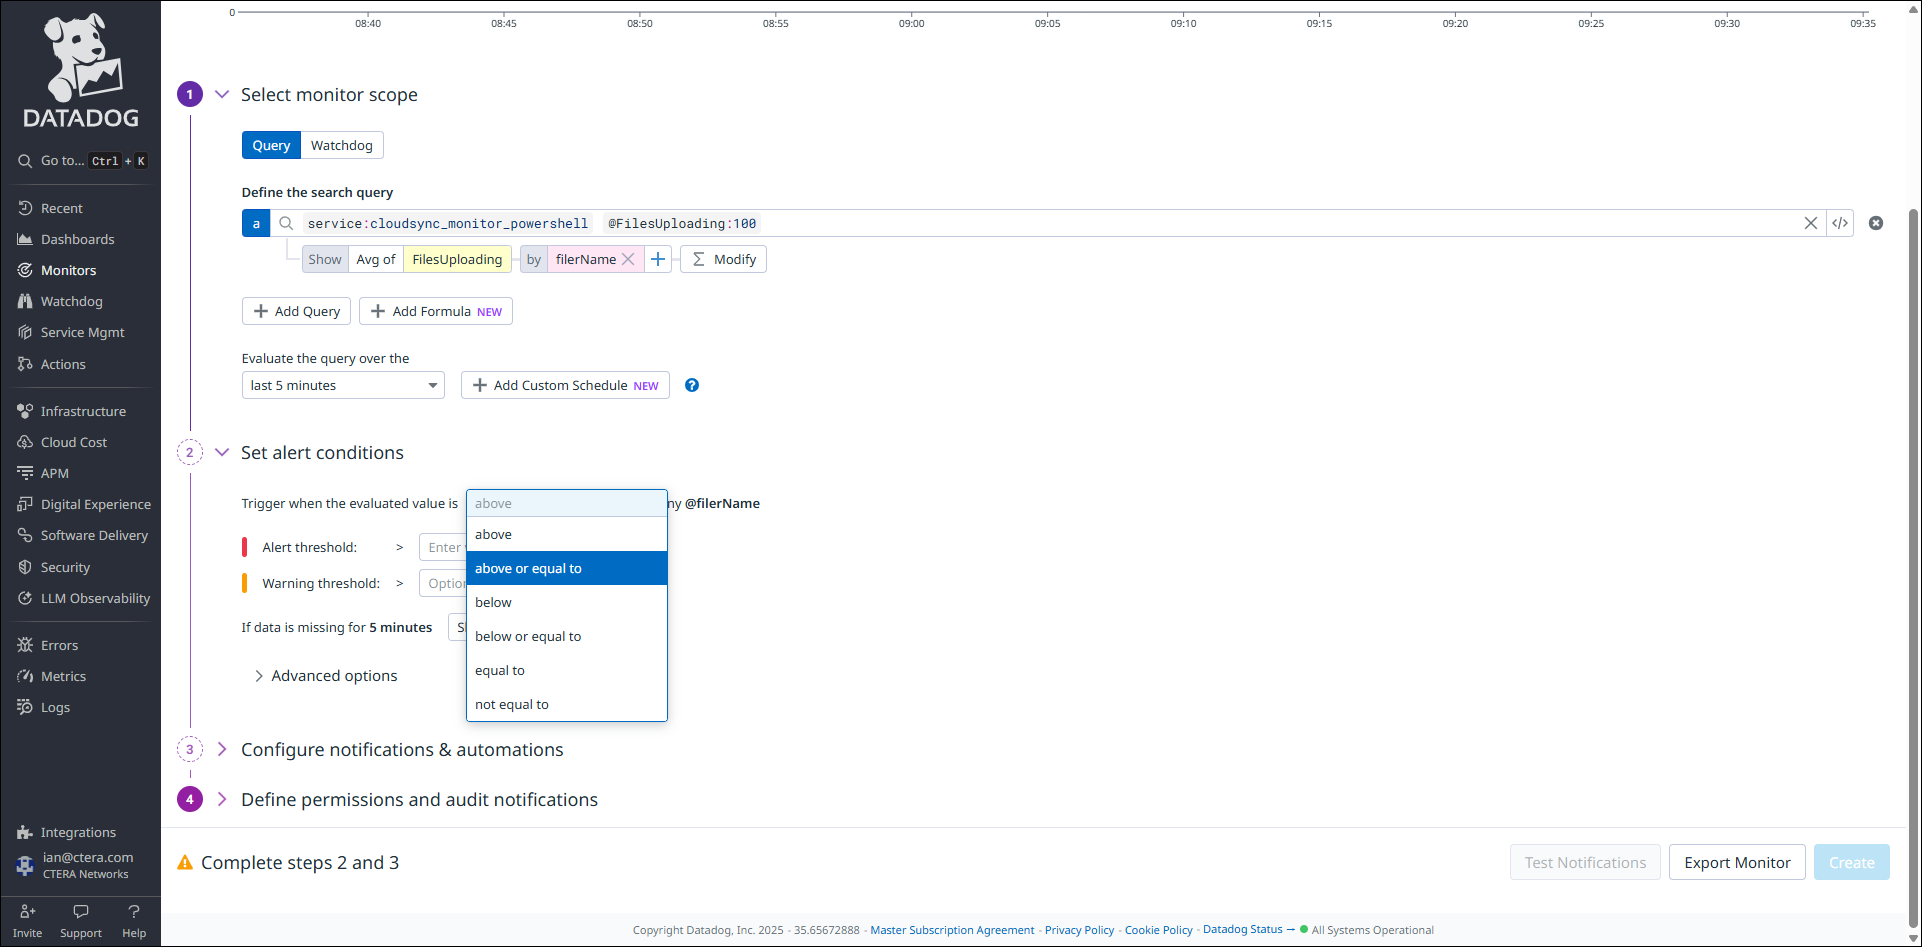
- Set the Alert threshold to
nand If data is missing for 5 Minutes to Show OK, where n is the alert threshold. For example setting Alert threshold to1means that the alert is based on receiving one log event with an uploadCount of 1.
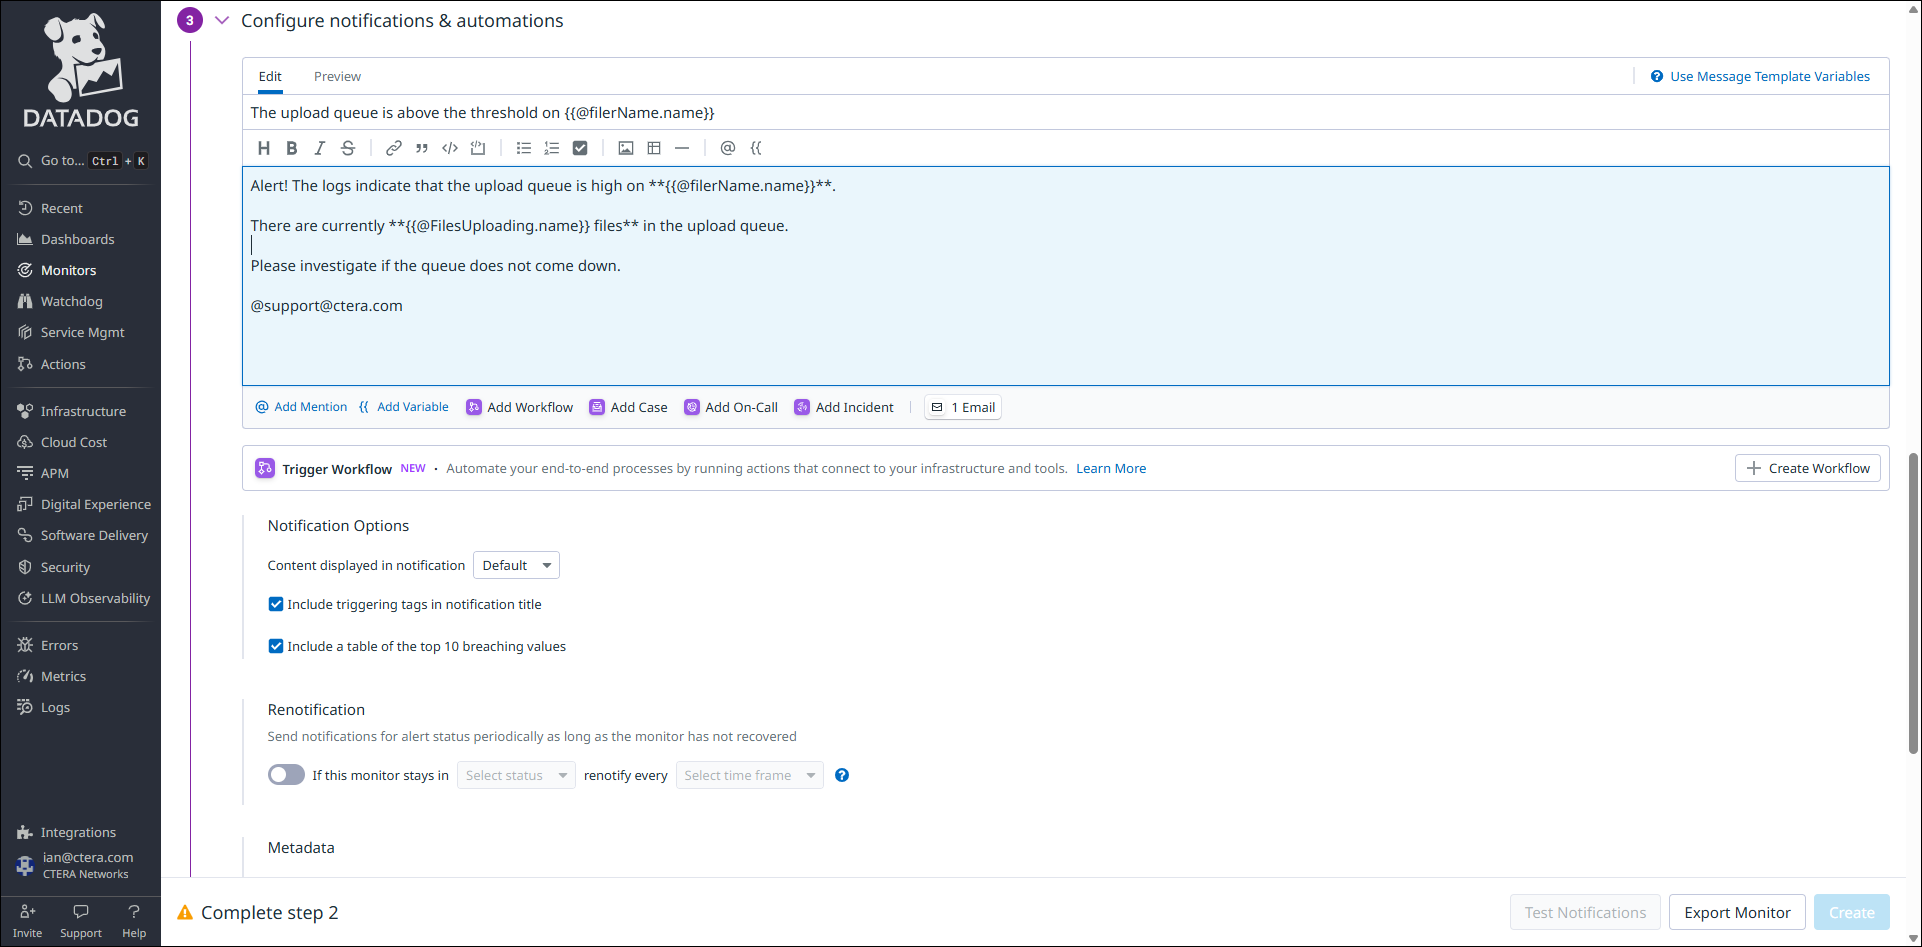
- In the Configure notifications & automations section define the warning notification. For example:
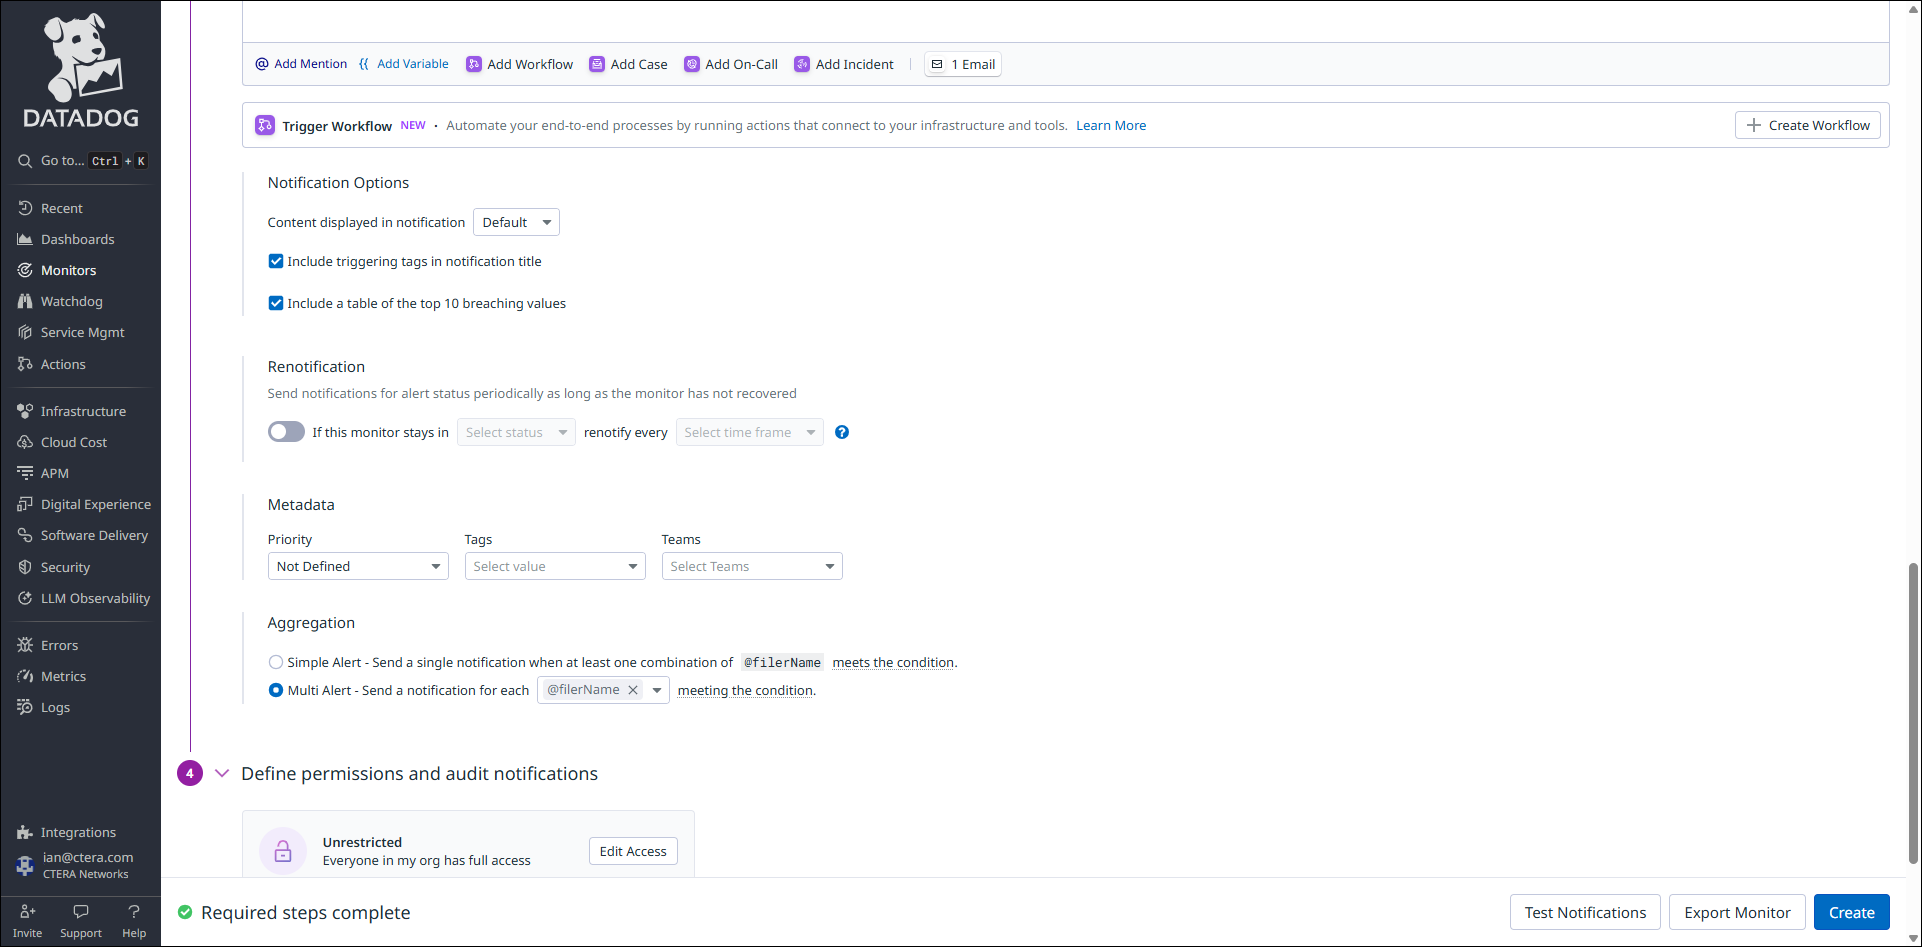
- Set Aggregation to Multi Alert and verify that it is using the @filerName condition value.
- Navigate to Monitors > New Monitor.
- Use the Windows Task Scheduler to schedule the script to run at the required interval, for example, every two minutes.