Monitor Edge Filer Caching
- 1 Minute to read
- Print
- DarkLight
- PDF
Monitor Edge Filer Caching
- 1 Minute to read
- Print
- DarkLight
- PDF
Article Summary
Share feedback
Thanks for sharing your feedback!
To monitor edge filer caching:
- In the Configuration view, select Cloud Drive > Cloud Drive in the navigation pane.
The Cloud Drive page is displayed.
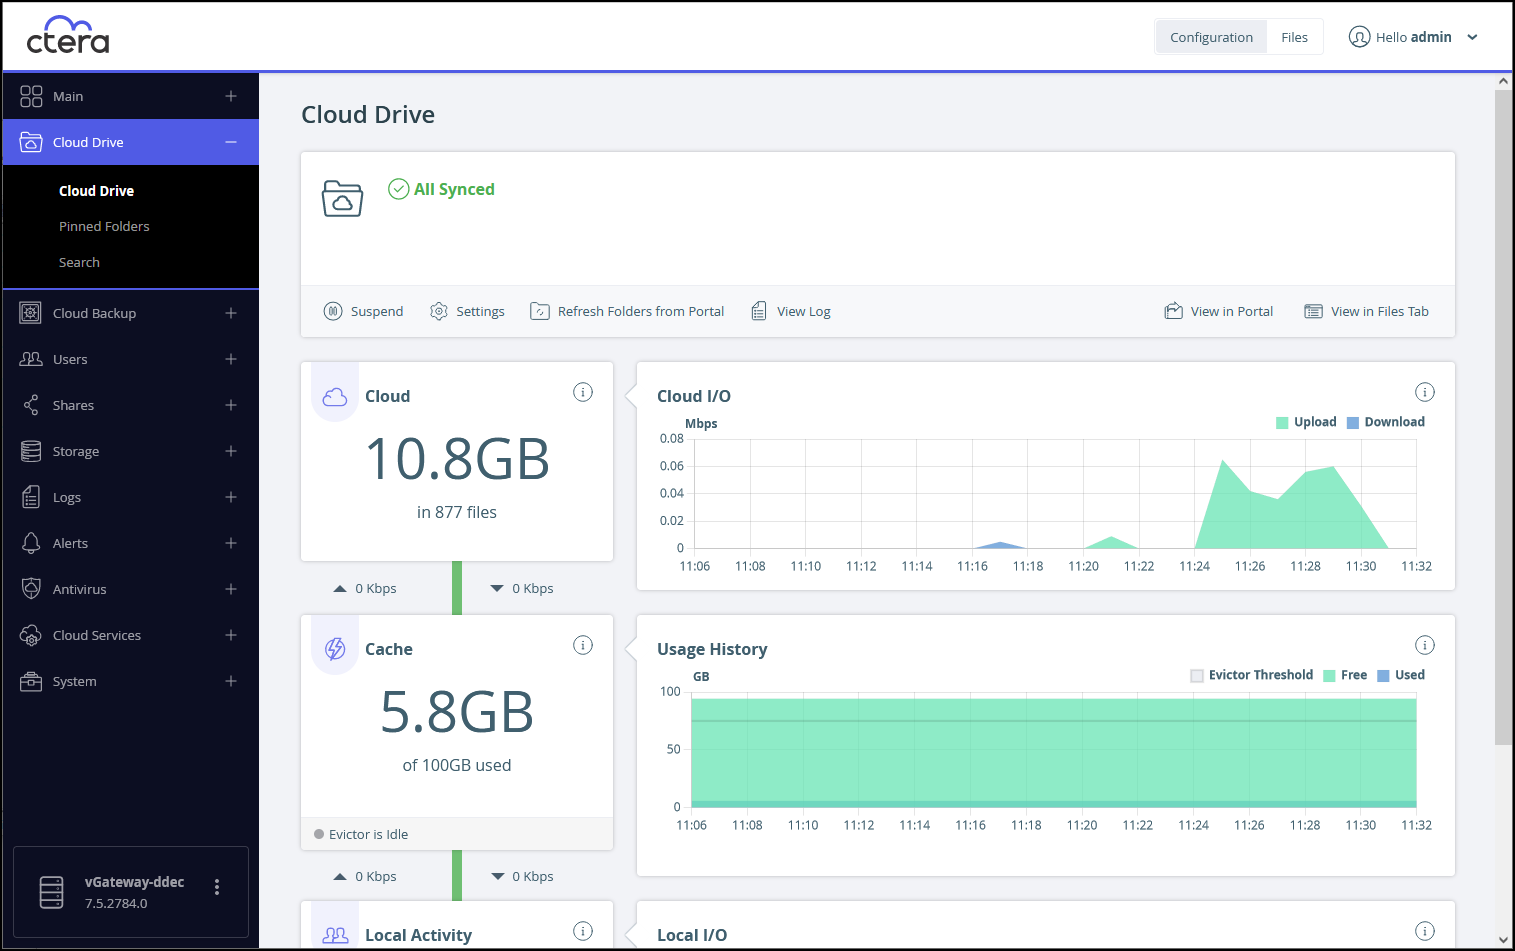

With a Caching Gateway, the following statistics are available:
- The number of files and amount of storage transferred between the CTERA Edge Filer and the CTERA Portal.
- The rate of transfer of data over time between the CTERA Edge Filer and the CTERA Portal.
- The amount of data currently in the cache and the total amount of storage available.
- The status of the evictor.
- The amount of data in the cache over time.
- The number of currently active clients and the read and write rates between these client and the CTERA Edge Filer.
- The read and write rates between clients and the CTERA Edge Filer over time.
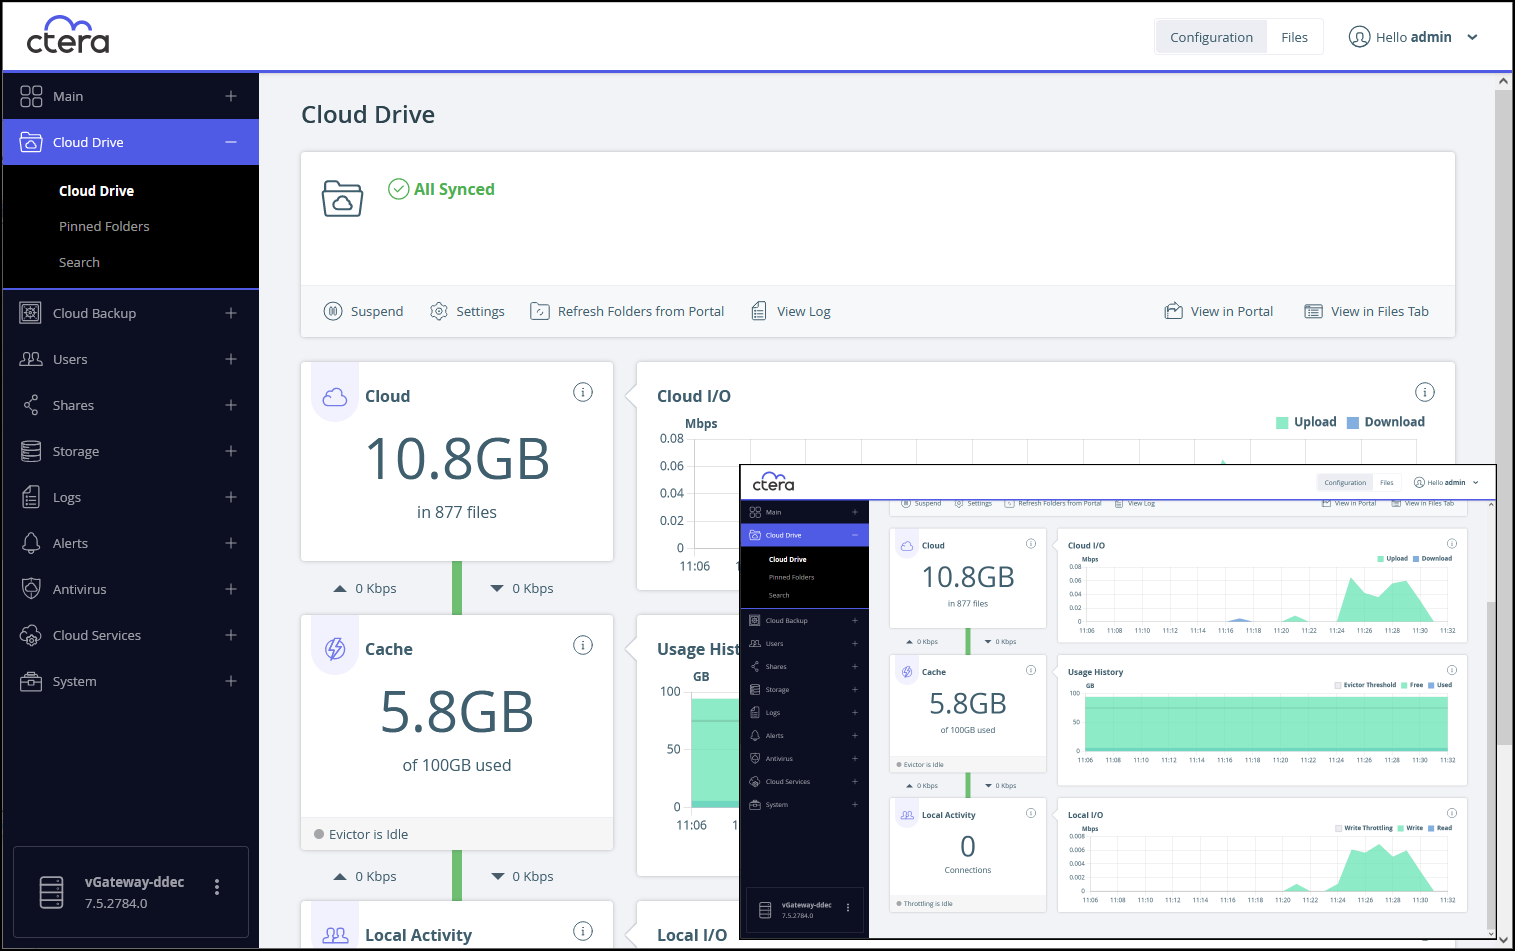

The graphs show the following:
Cloud – The amount of storage on the CTERA Portal. The graph displays the rate of transfer of data over time from the edge filer to the portal (Upload) and the portal to the edge filer over time (Download).
Cache – The current amount of data in the cache and the cache size and the status of the evictor, whether it is running or not. The graph displays the evictor threshold, the amount of data in the cache, and the amount of free space in the cache over time.
Local Activity – The number of connections to the edge filer and the current throttling for a connection and not of the aggregated value of all the connections. The graph displays the write throttling, the write rate from the client to the edge filer, and the read rate from the edge filer to the client over time.
Was this article helpful?