Monitoring the CTERA Edge Filer
- 2 Minutes to read
- Print
- DarkLight
- PDF
Monitoring the CTERA Edge Filer
- 2 Minutes to read
- Print
- DarkLight
- PDF
Article Summary
Share feedback
Thanks for sharing your feedback!
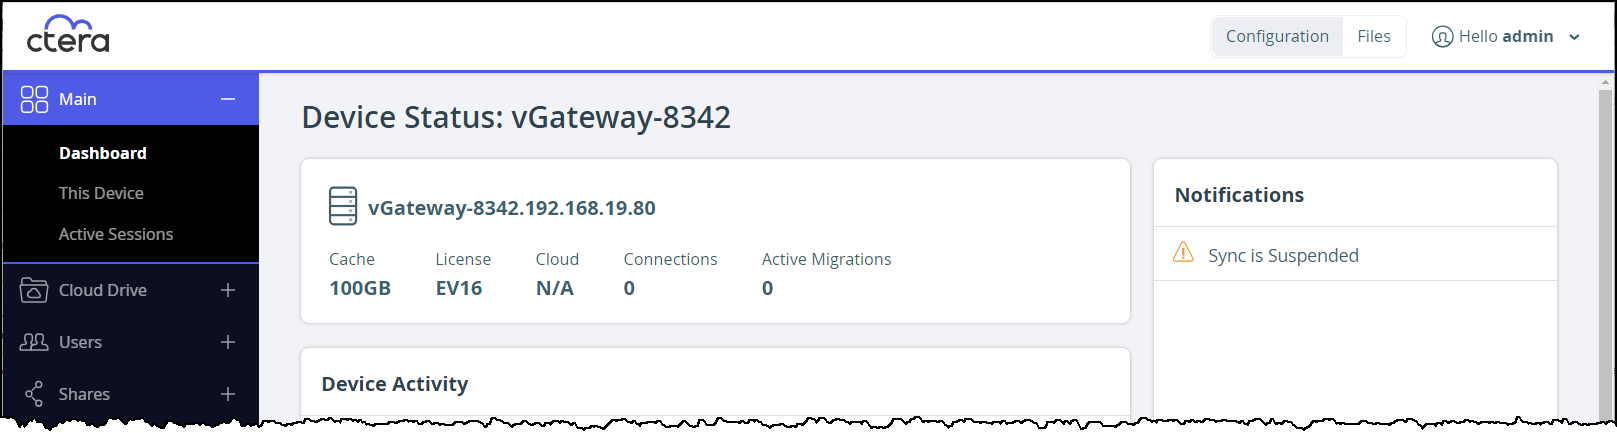
The CTERA Edge Filer dashboard provides an overview of the CTERA Edge Filer.
To view the status dashboard:
- In the Configuration view, select Main > Dashboard in the navigation pane.
The Dashboard page is displayed.
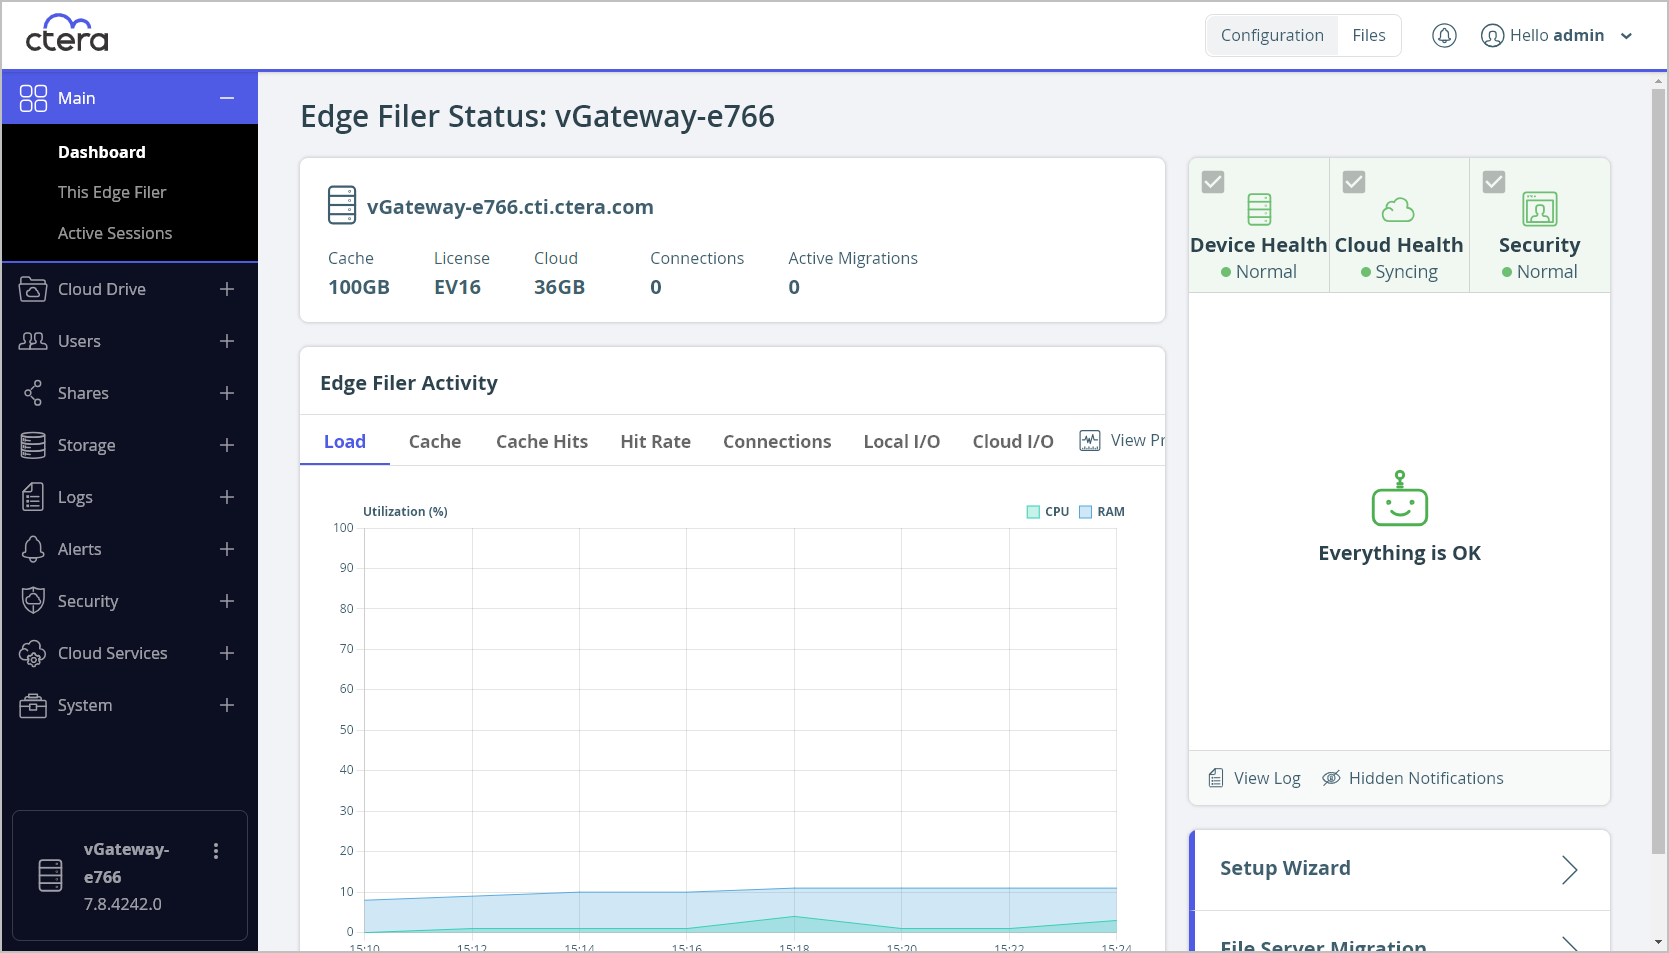

The dashboard displays the following information:
- An overview of the edge filer:
- The edge filer name and IP.
- The total storage available locally on the edge filer.
- The license.
- The amount of storage that is synced from the portal.
- The number of connections to the edge filer.
- The number of active migrations.
- Device Activity – The edge filer activity over time, displayed graphically:
Load – The CPU and RAM usage.
When the Load activity is displayed, you can also display the processes currently running:- Click View Processes.
The Top Processes window is displayed.
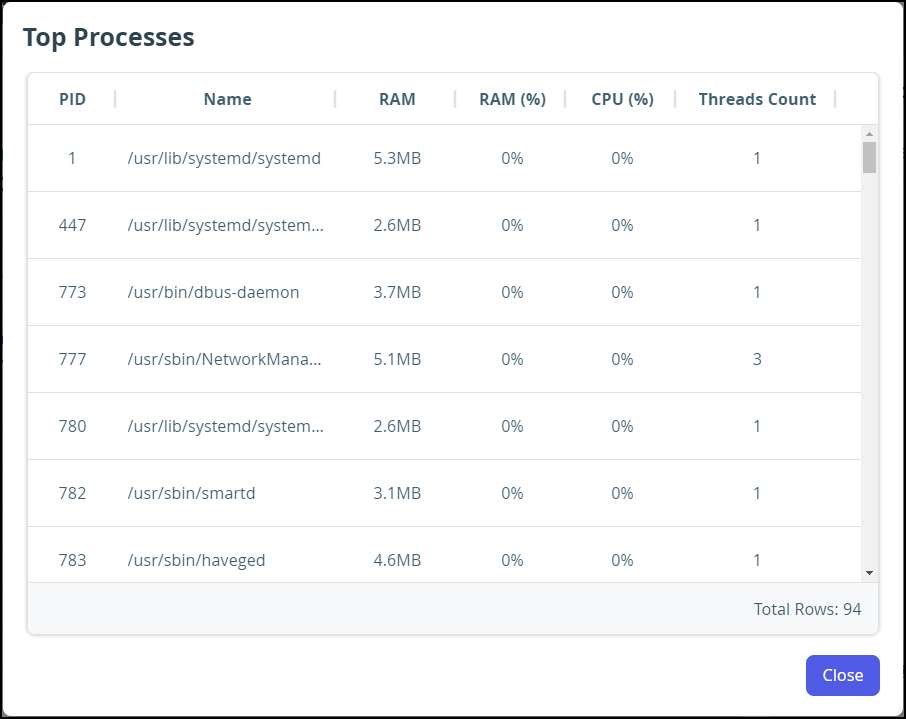
Where:
PID – The process identifier.
Name – The process name.
RAM – The amount of RAM used by this process.
RAM (%) – The percentage of the RAM used by this process.
CPU – The percentage of CPU used by this process.
Threads Count – The number of threads spawned by the process.
- Click View Processes.
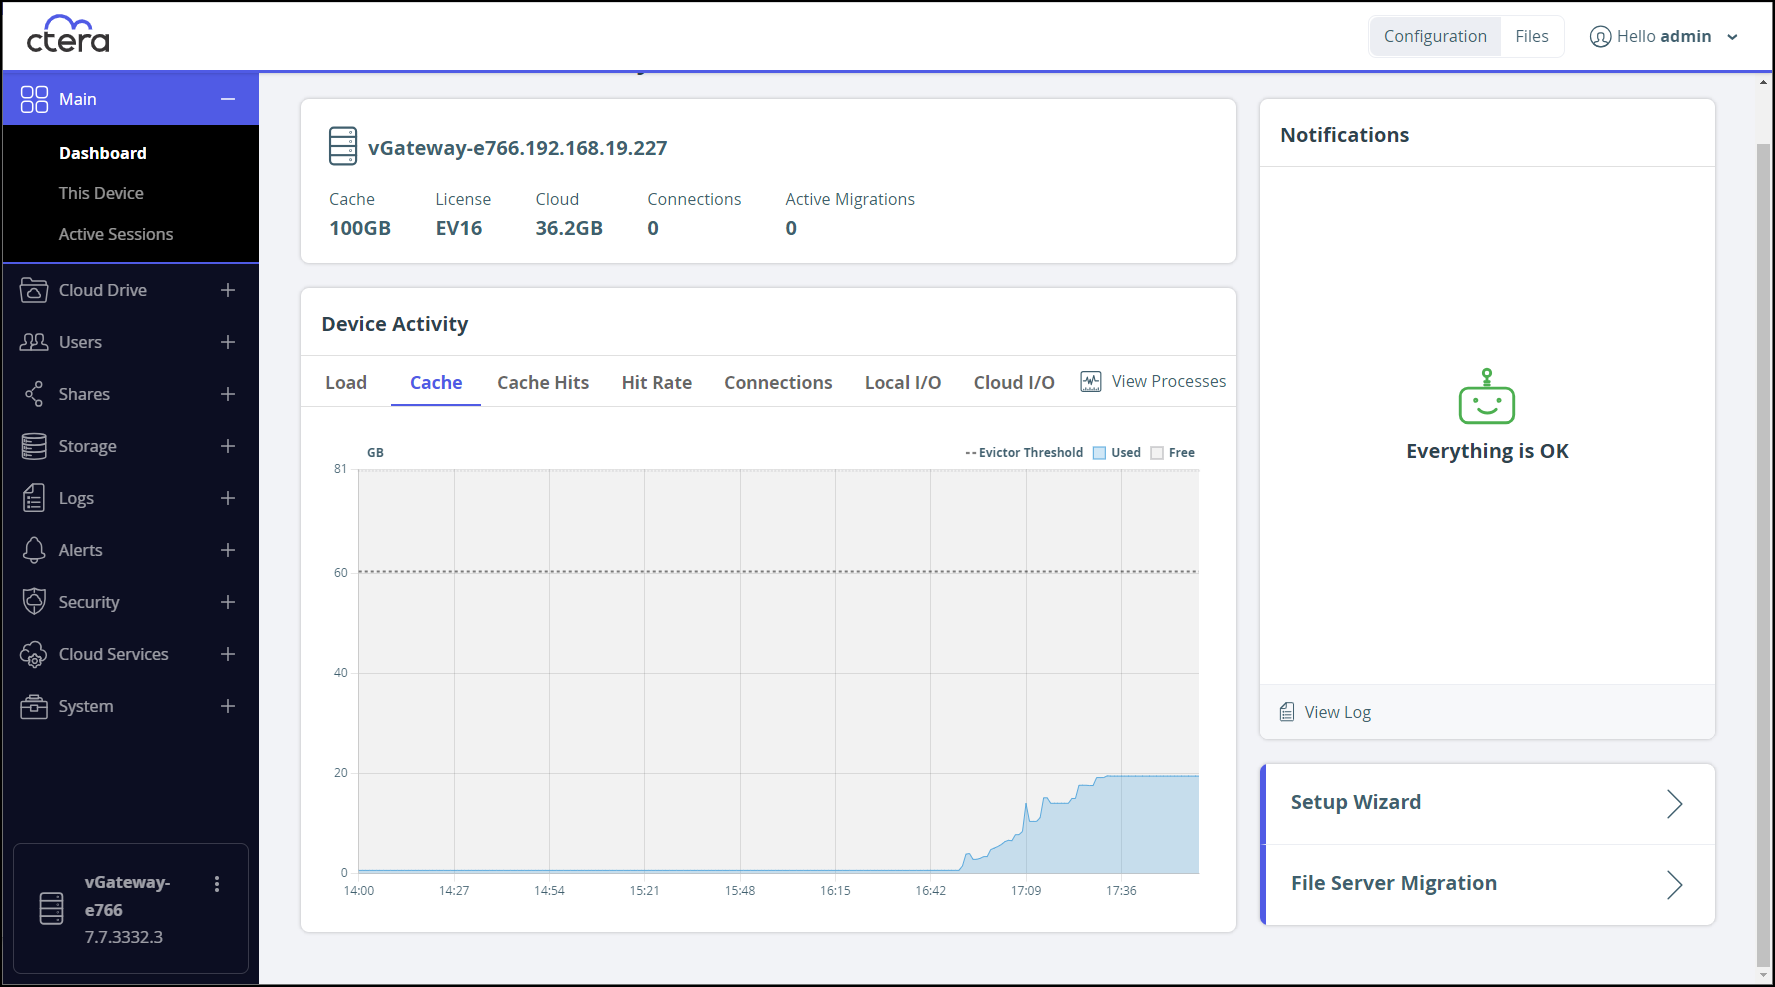
Cache – The amount of storage used in the cache.
Cache Hits – The cache hits, misses and thrashing when accessing files and performing operations, such as write, on the files.
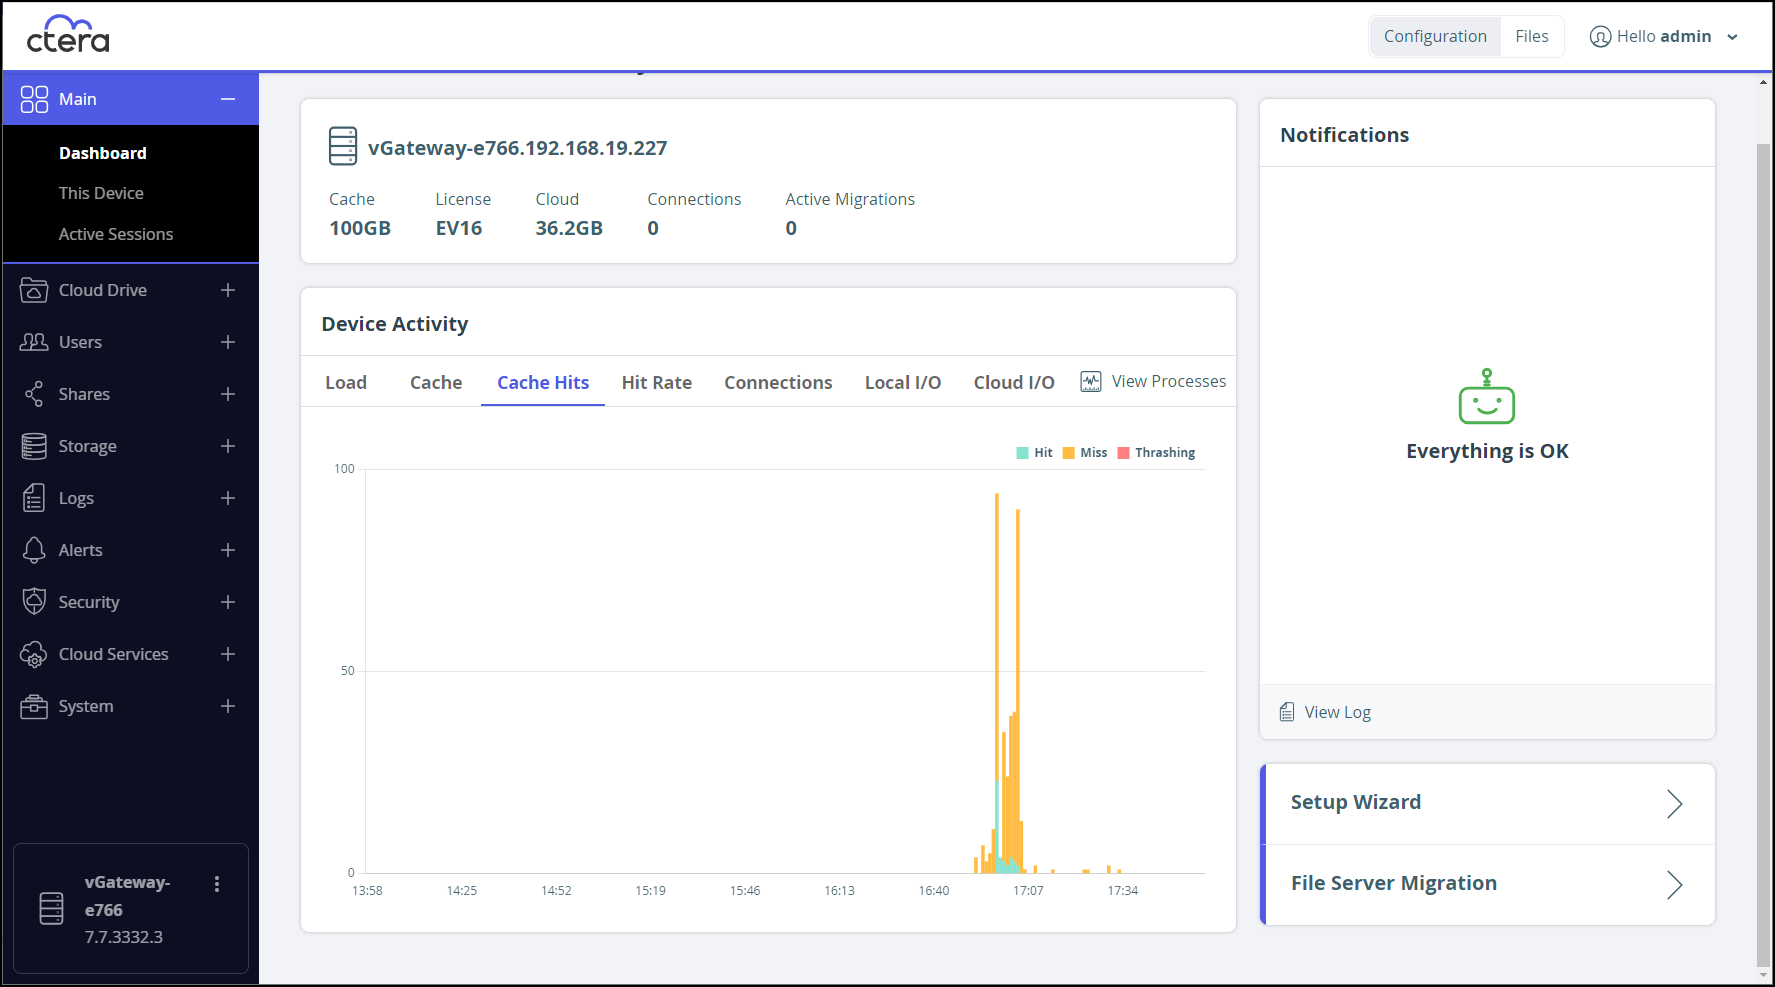
- Hit – The file was accessed from the cache: it was not a stub file.
- Miss – The file was a stub file that was downloaded from the portal. However, the file had not been accessed within the last 24 hours.
- Thrashing – The file was a stub file that was downloaded from the portal. The file was not in the cache for less than 24 hours. Thrashing means that files that were recently evicted are needed.
Hit Rate – The hit rate: A measurement of how many content requests a cache is able to fill successfully, hits, compared to how many requests it receives. The higher the cache hit ratio, the healthier the system.
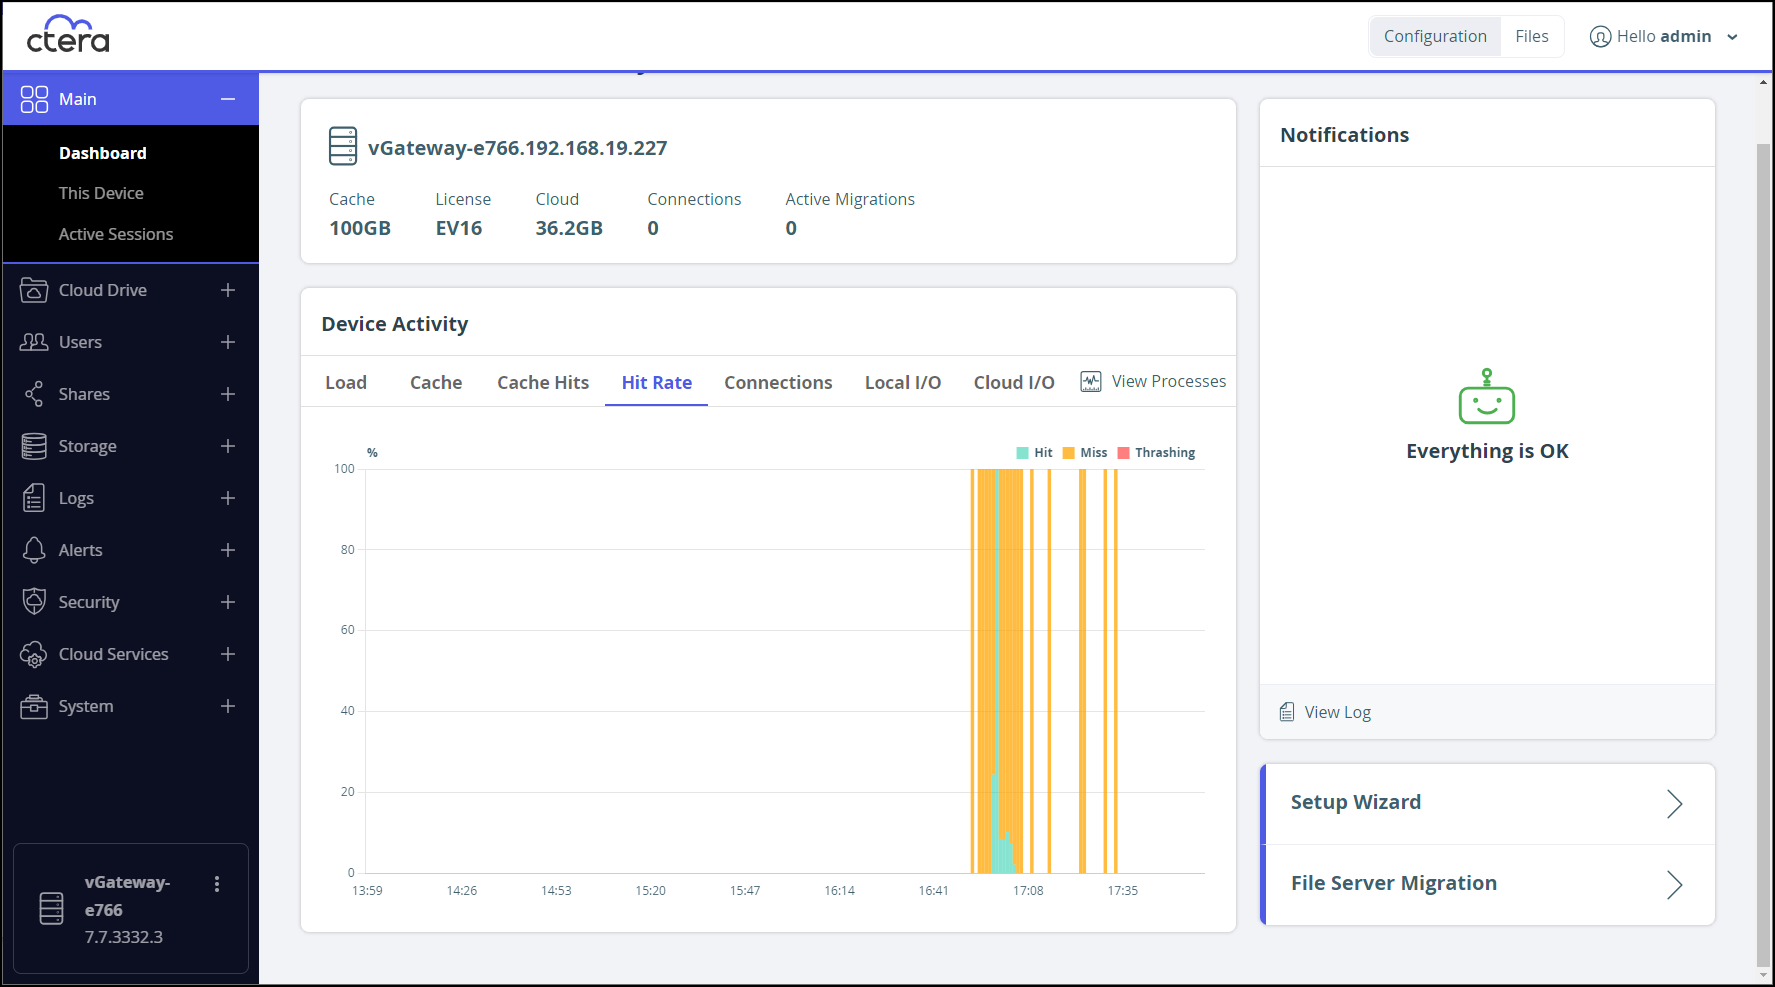 Note
NoteYou can use the cache hit rate to determine peak usage times.
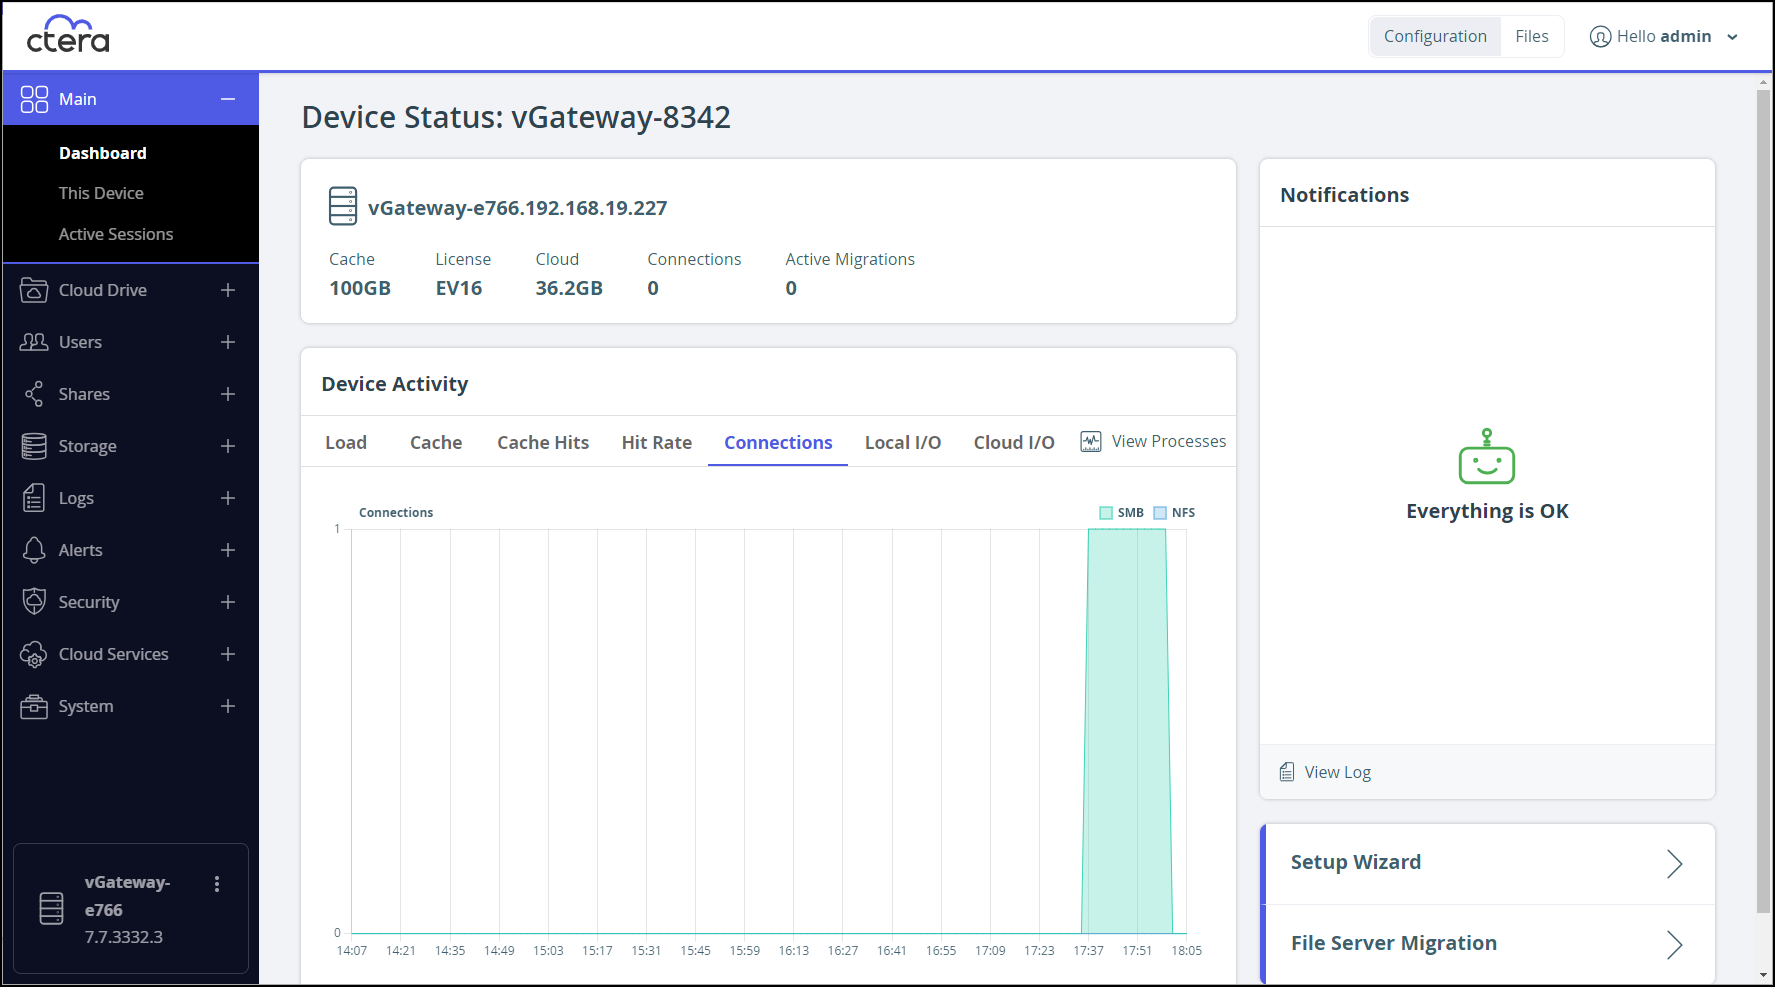
Connections – The number of SMB/CIF and NFS connections.
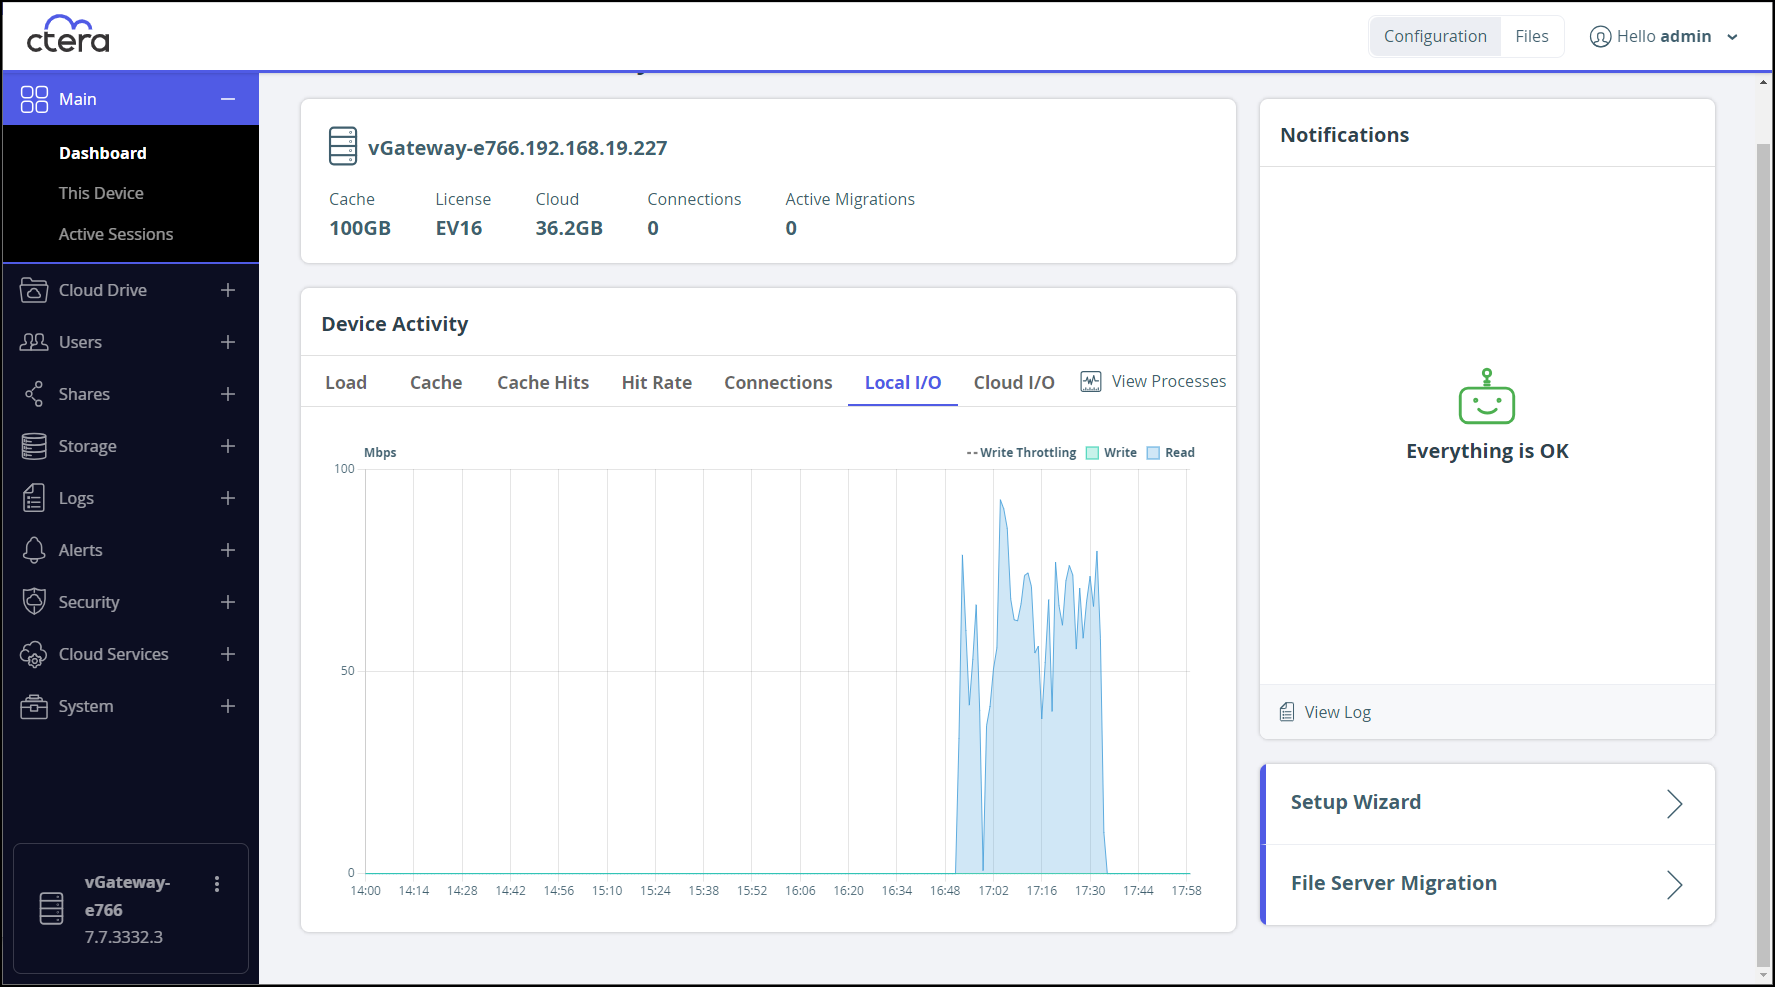
Local I/O – The I/O between the CTERA Edge Filer and local connections.
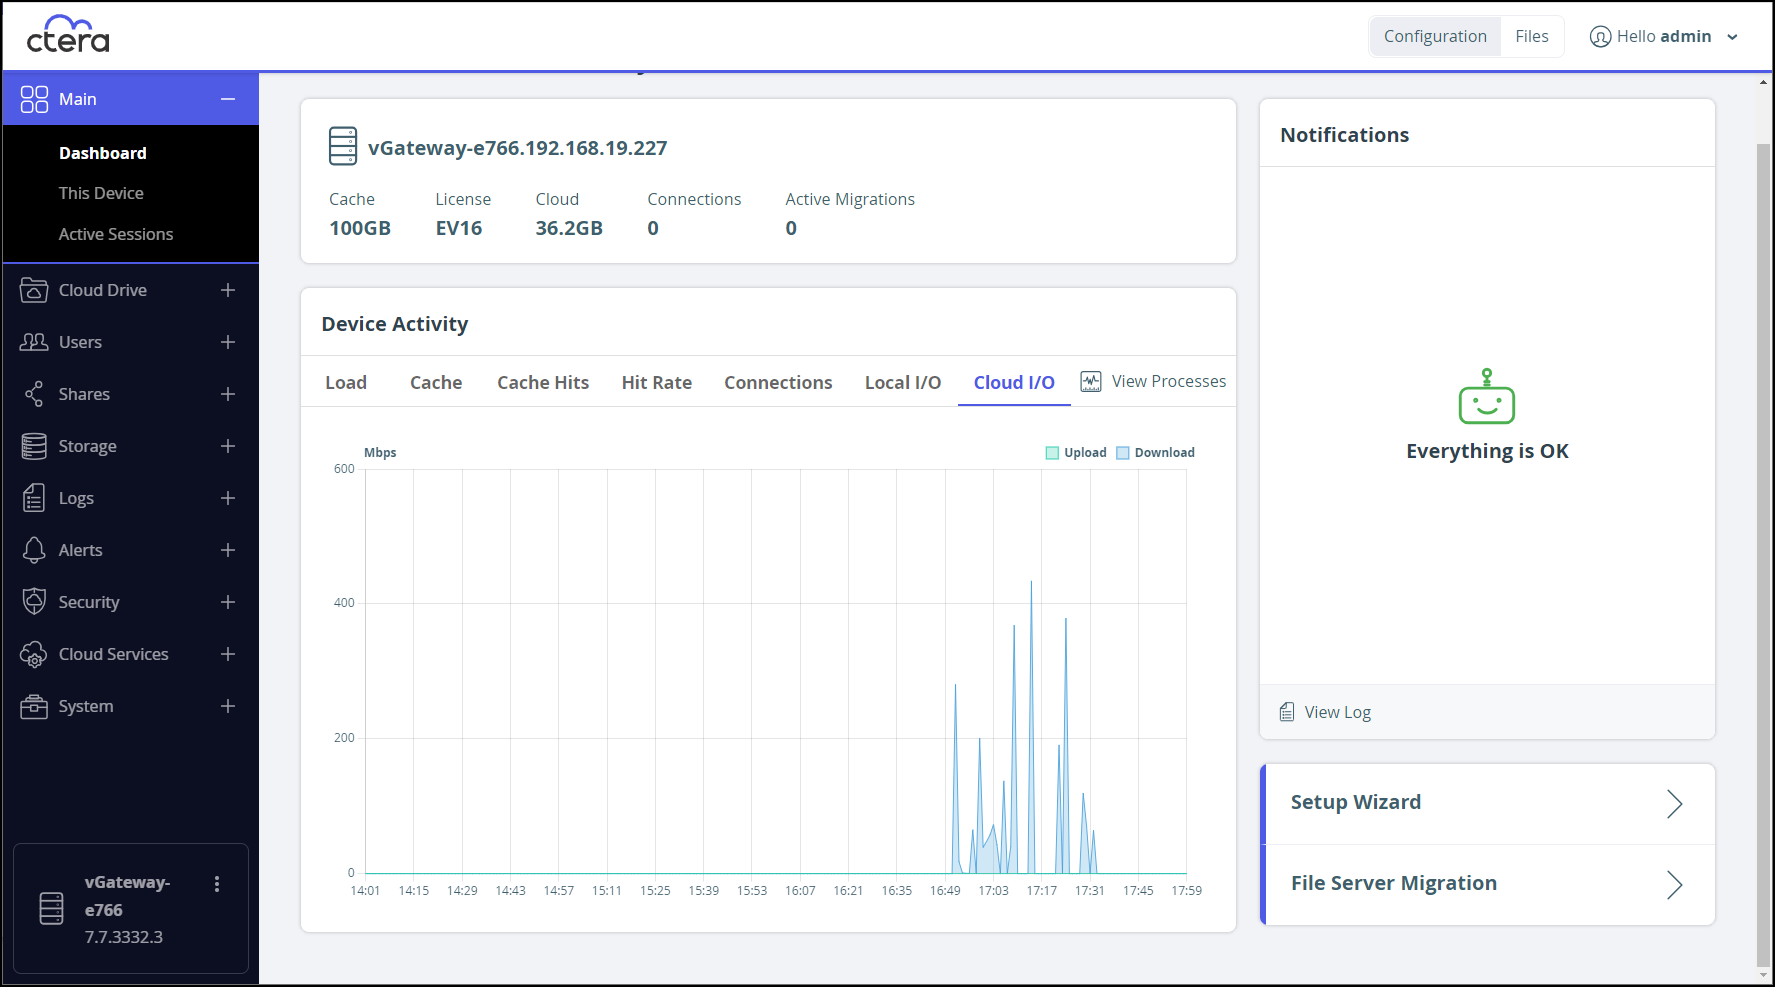
Cloud I/O – The I/O between the CTERA Edge Filer and CTERA Portal.
- Notifications – Notifications for the administrator about the edge filer. You can go straight to the Log Viewer to get more information by clicking View Log.
- Links to the Setup Wizard and File Server Migration.


Was this article helpful?