You can use Datadog running on a Windows PC to monitor the edge filer, as described in Monitor an Edge Filer Using Datadog.
The CTERA Edge Filer dashboard provides information to monitor the CTERA Edge Filer.
To monitor the edge filer:
- In the Configuration view, select Main > Dashboard in the navigation pane.
The dashboard page is displayed.
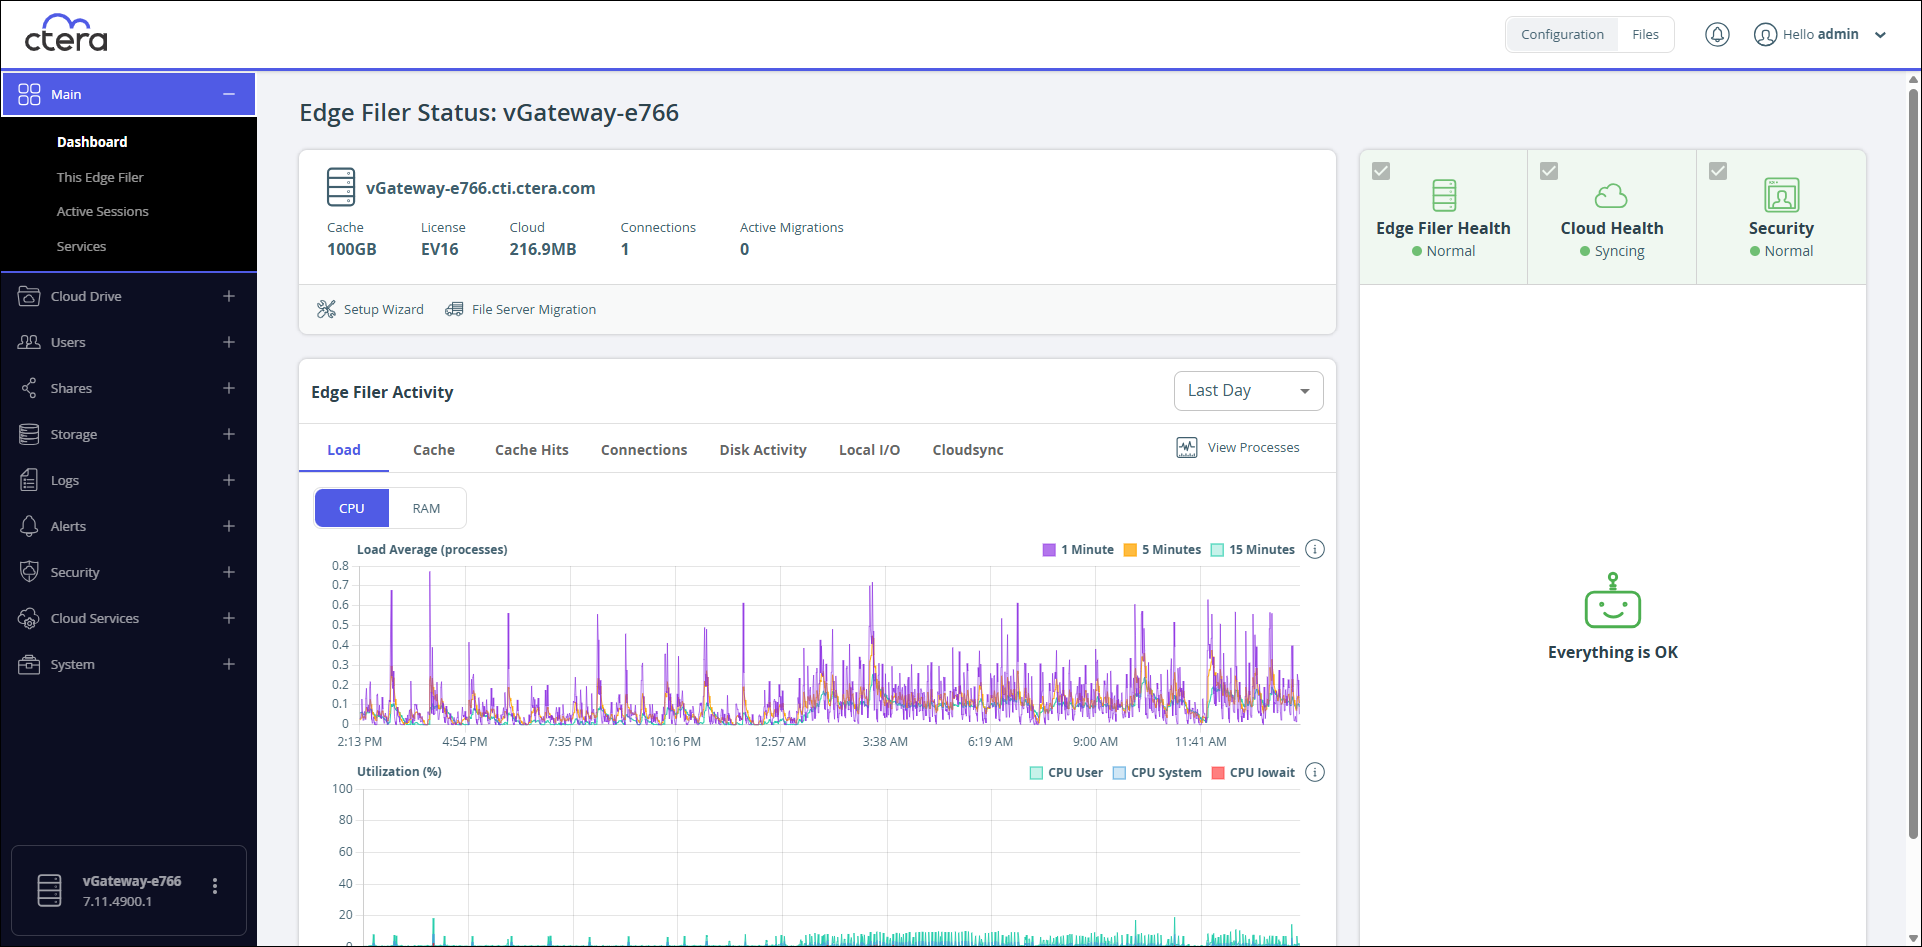
The dashboard displays the following information:
- An overview of the edge filer:
- The edge filer name and IP.
- The total storage available locally on the edge filer.
- The license.
- The amount of storage that is synced from the portal.
- The number of connections to the edge filer.
- The number of active migrations.
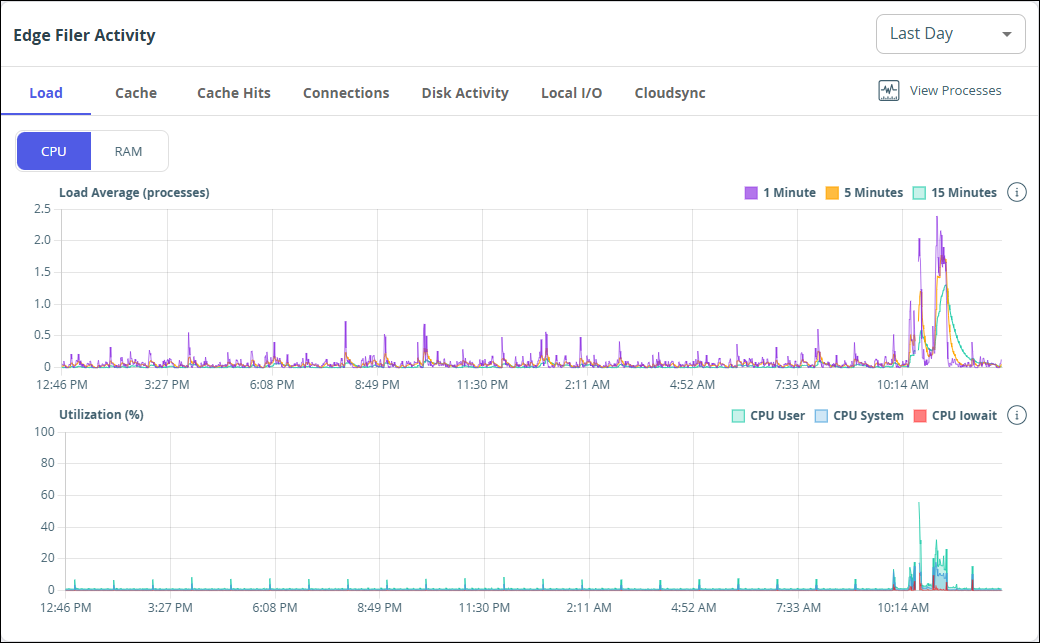
- Edge Filer Activity – The edge filer activity over time, displayed graphically. The graphs can show up to one year of history.
-
Load – The CPU and RAM loads.
CPU – The CPU load and utilization.
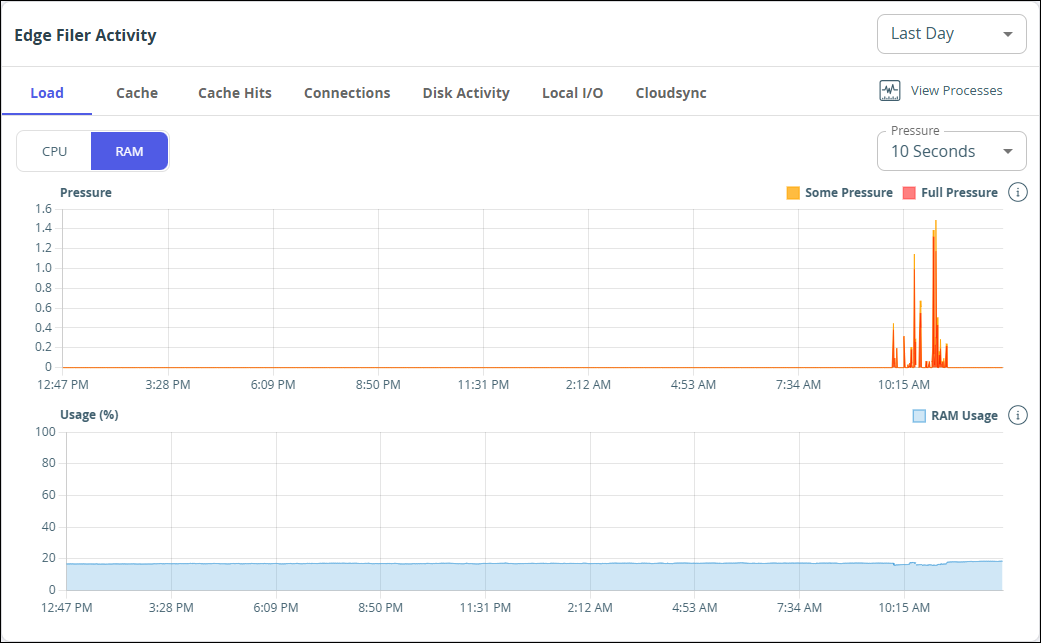
RAM – The RAM pressure and usage. RAM pressure is how efficient the RAM usage is and if the pressure is full for too long it is an indicator that more RAM is needed.
When the Load activity is displayed, you can also display the processes currently running.- Click View Processes.
The Top Processes window is displayed.
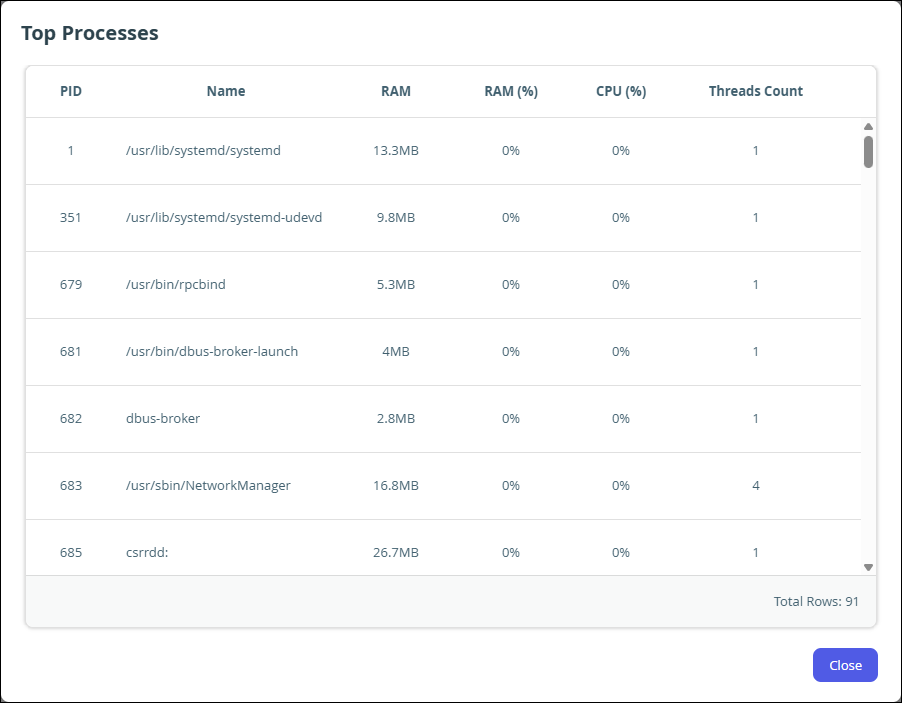
Where:
PID – The process identifier.
Name – The process name.
RAM – The amount of RAM used by this process.
RAM (%) – The percentage of the RAM used by this process.
CPU (%) – The percentage of CPU used by this process.
Threads Count – The number of threads spawned by the process.
- Click View Processes.
-
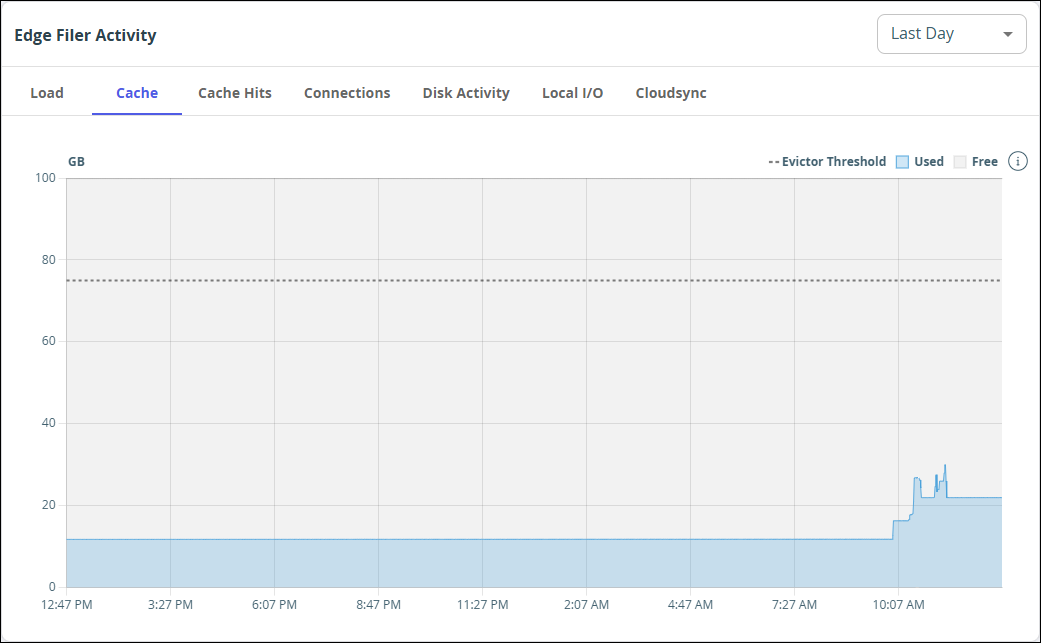
Cache – The amount of storage used in the cache.
-
Cache Hits – The cache hits, misses and thrashing when accessing files and performing operations, such as write, on the files.
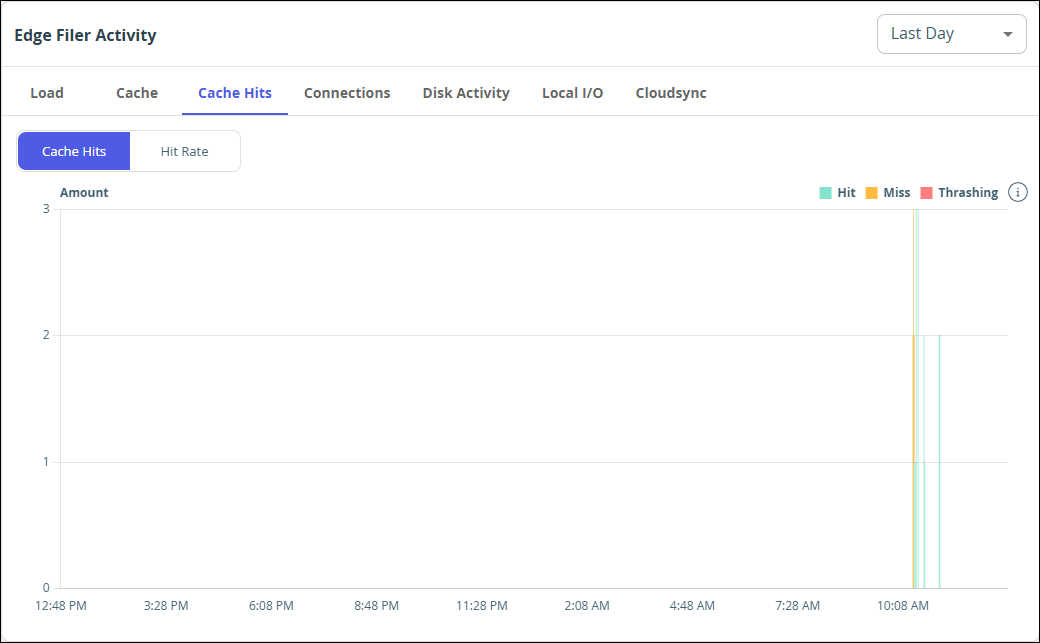
- Hit – The file was accessed from the cache: it was not a stub file.
- Miss – The file was a stub file that was downloaded from the portal. However, the file had not been accessed within the last 24 hours.
- Thrashing – The file was a stub file that was downloaded from the portal. The file was not in the cache for less than 24 hours. Thrashing means that files that were recently evicted are needed.
-
Hit Rate – A measurement of how many content requests a cache is able to fill successfully, hits, compared to how many requests it receives. The higher the cache hit ratio, the healthier the system.
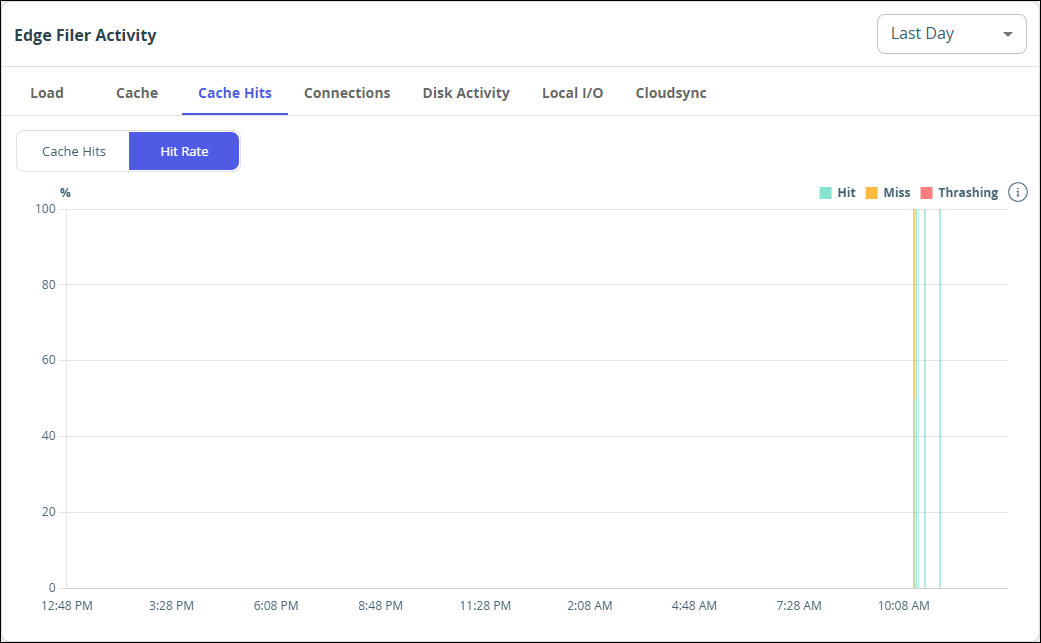 Note
NoteYou can use the cache hit rate to determine peak usage times.
-
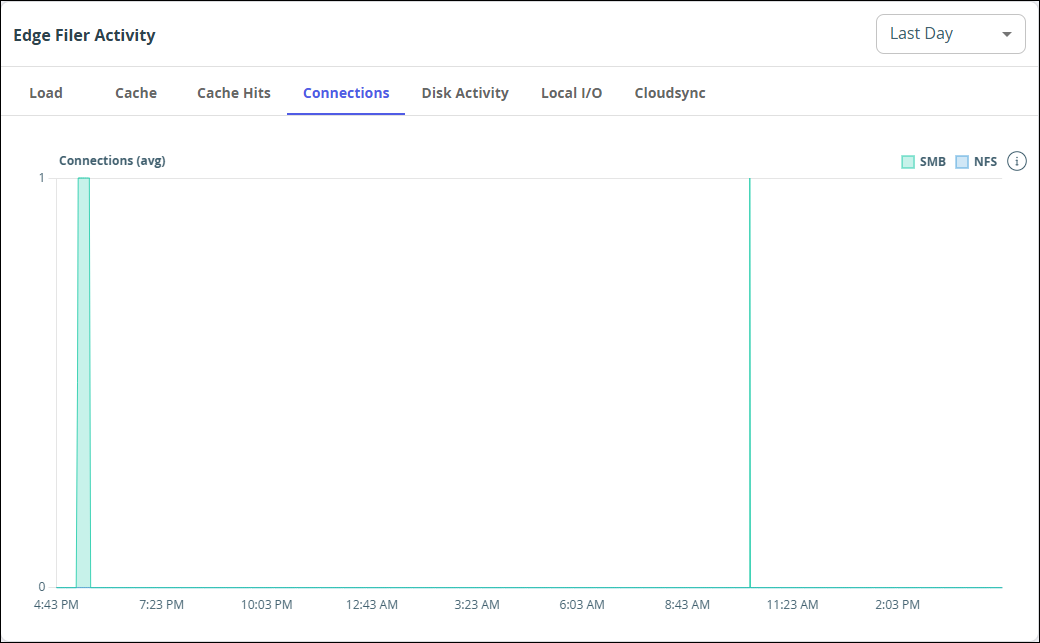
Connections – The number of SMB and NFS connections and the length of time connected.
-
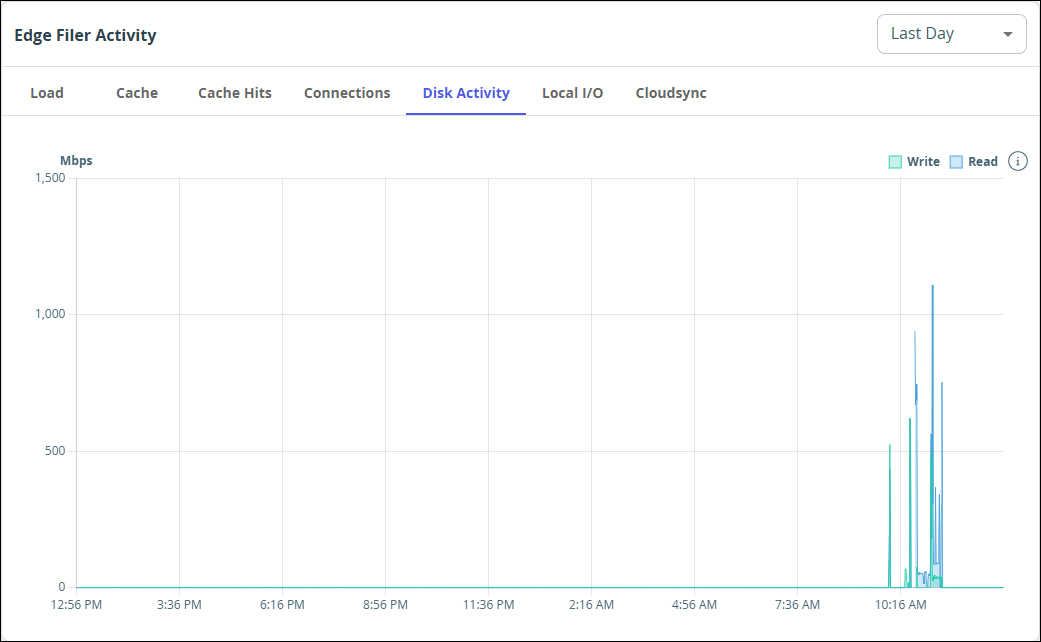
Disk Activity – The reads and writes to the disk.
-
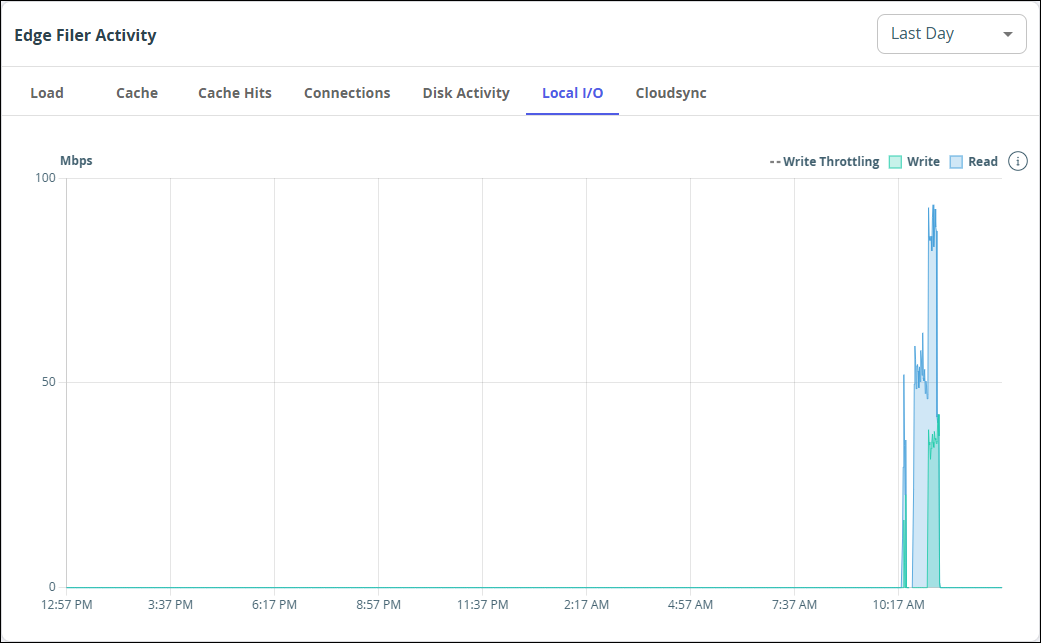
Local I/O – The I/O between the CTERA Edge Filer and local connections.
-
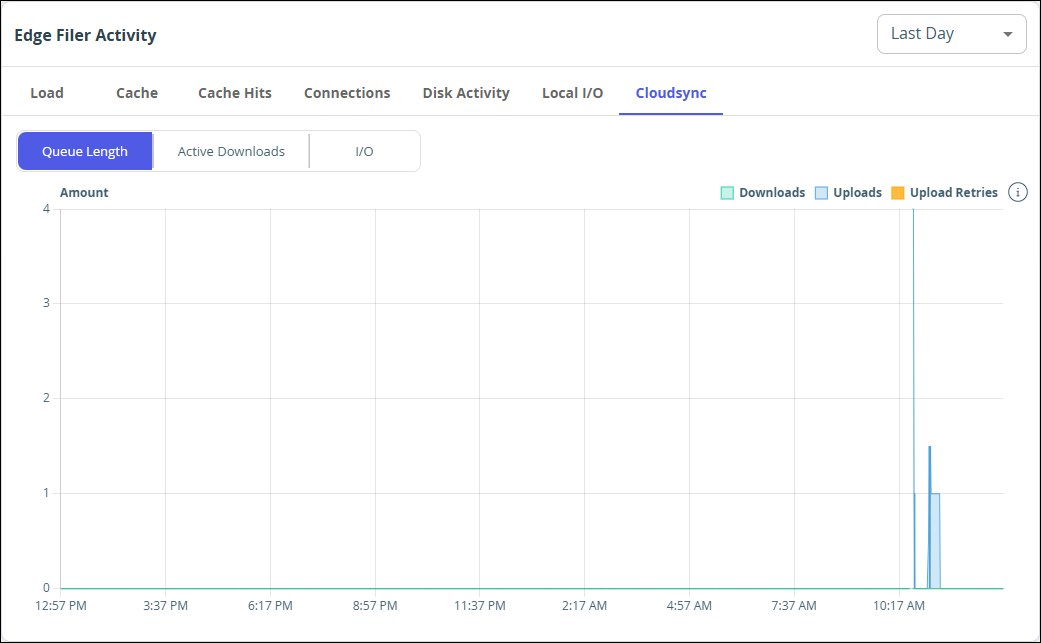
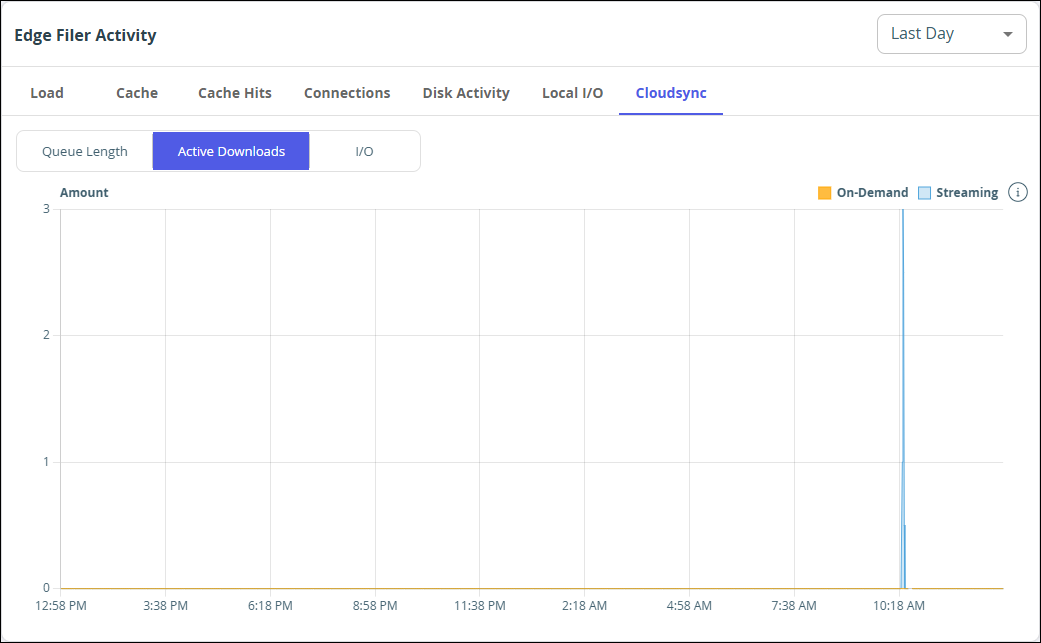
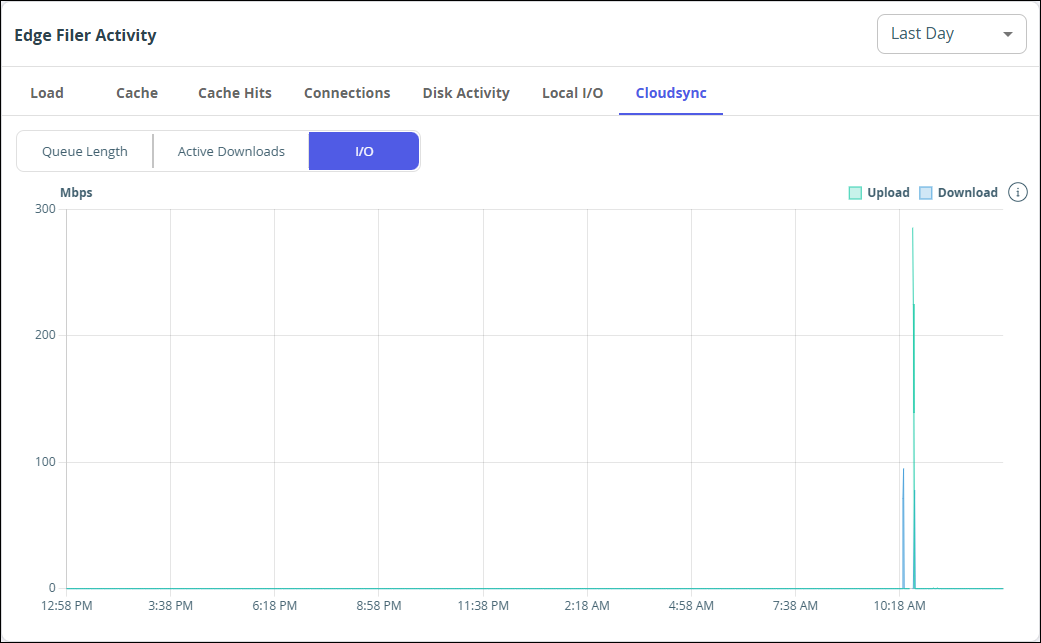
Cloudsync – The sync status between the CTERA Edge Filer and CTERA Portal.
Queue Length – The downloads, uploads and upload retries between the edge filer and the portal.
Active Downloads – The downloads that were triggered by a user requesting a file from the portal and streaming downloads.
I/O – Cloud upload and download speeds.
-
- Notifications – Notifications for the administrator about the edge filer. For details, see Edge Filer Notifications.