The portal interface consists of the following elements:
Top bar – The list of portals in a drop-down menu and the user name at the top right. Clicking the avatar or administrator initials next to the name displays additional options, such as access to online help.

Navigation Pane – To navigate between pages to manage the portal and the portal version.
Content area – Displays the page content.
The Main Dashboard
The dashboard includes Portal Overview, License Management, Data Services, and Platform Monitoring tabs and a Notifications section.
Viewing Notifications in the Main Dashboard
The dashboard displays a summary of active notifications.
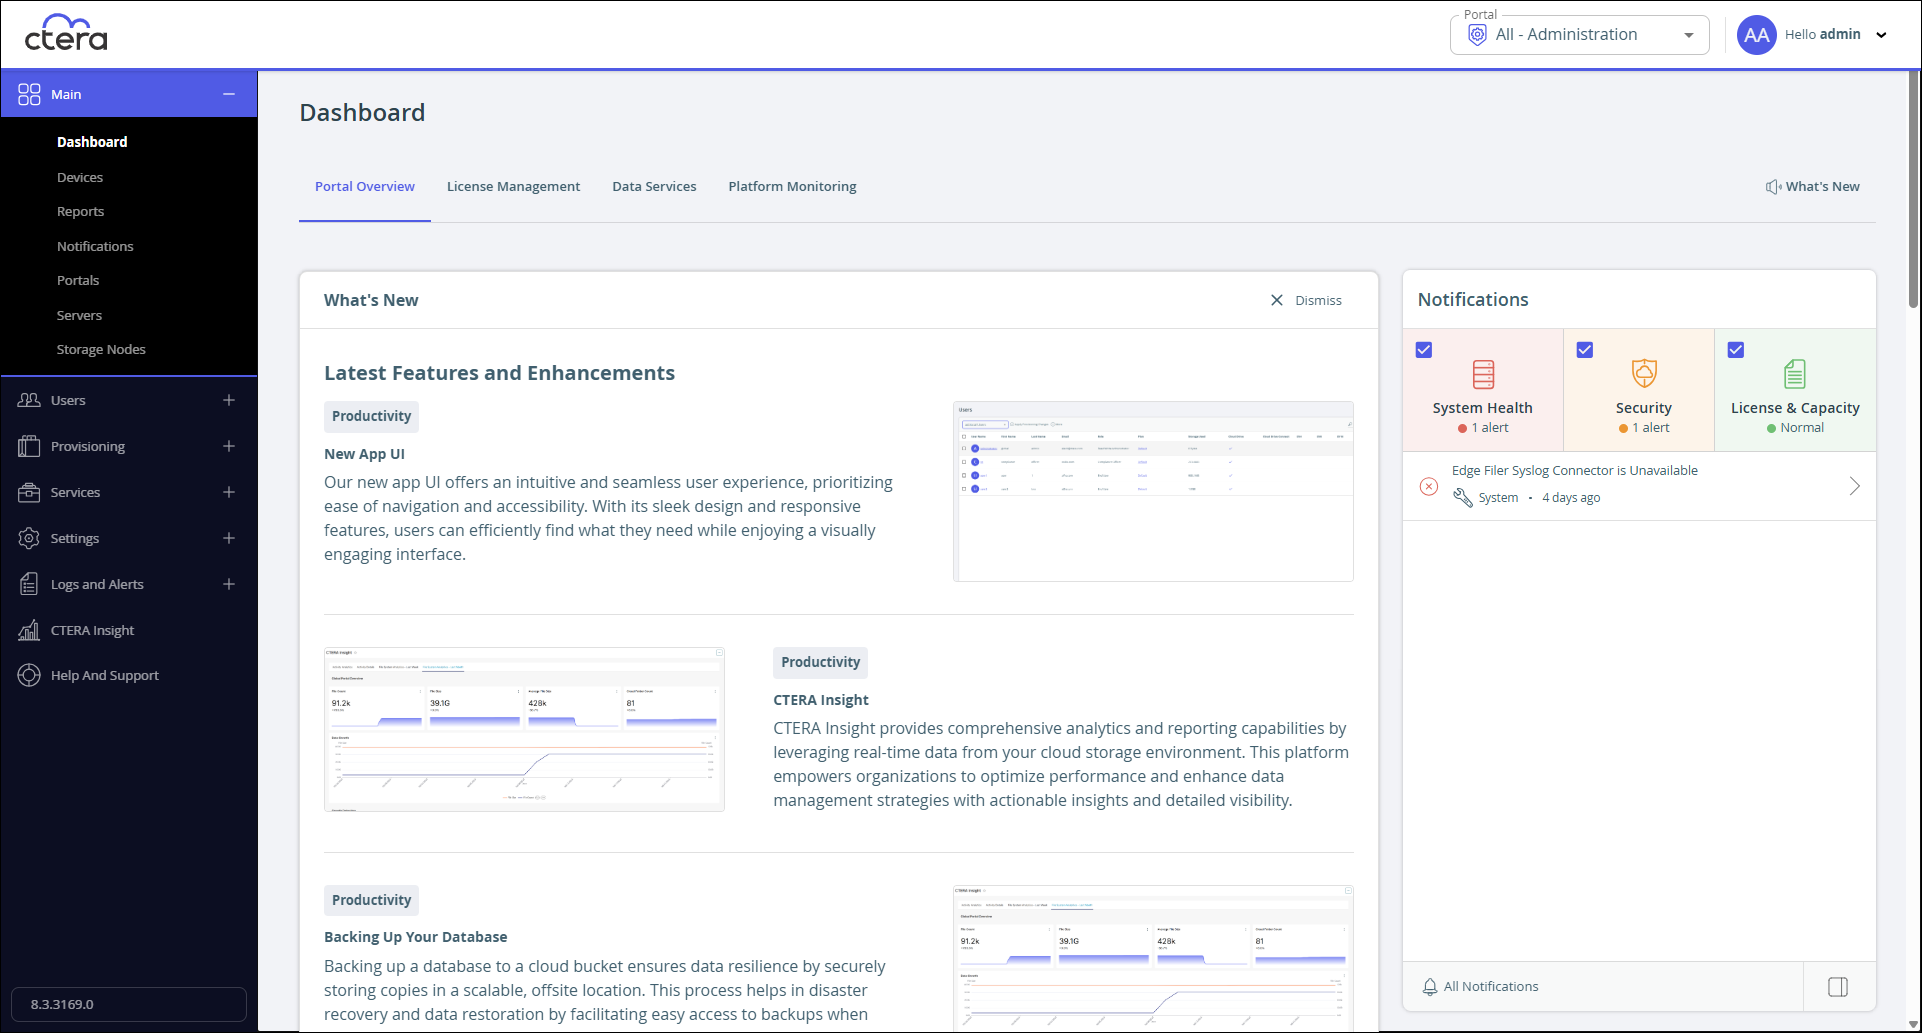
For details of all notifications in the Notifications page, click on All Notifications. For more details about notifications, see Managing Notifications and Email Templates.
Portal Overview
The Portal Overview tab displays an overview of the CTERA Portal.
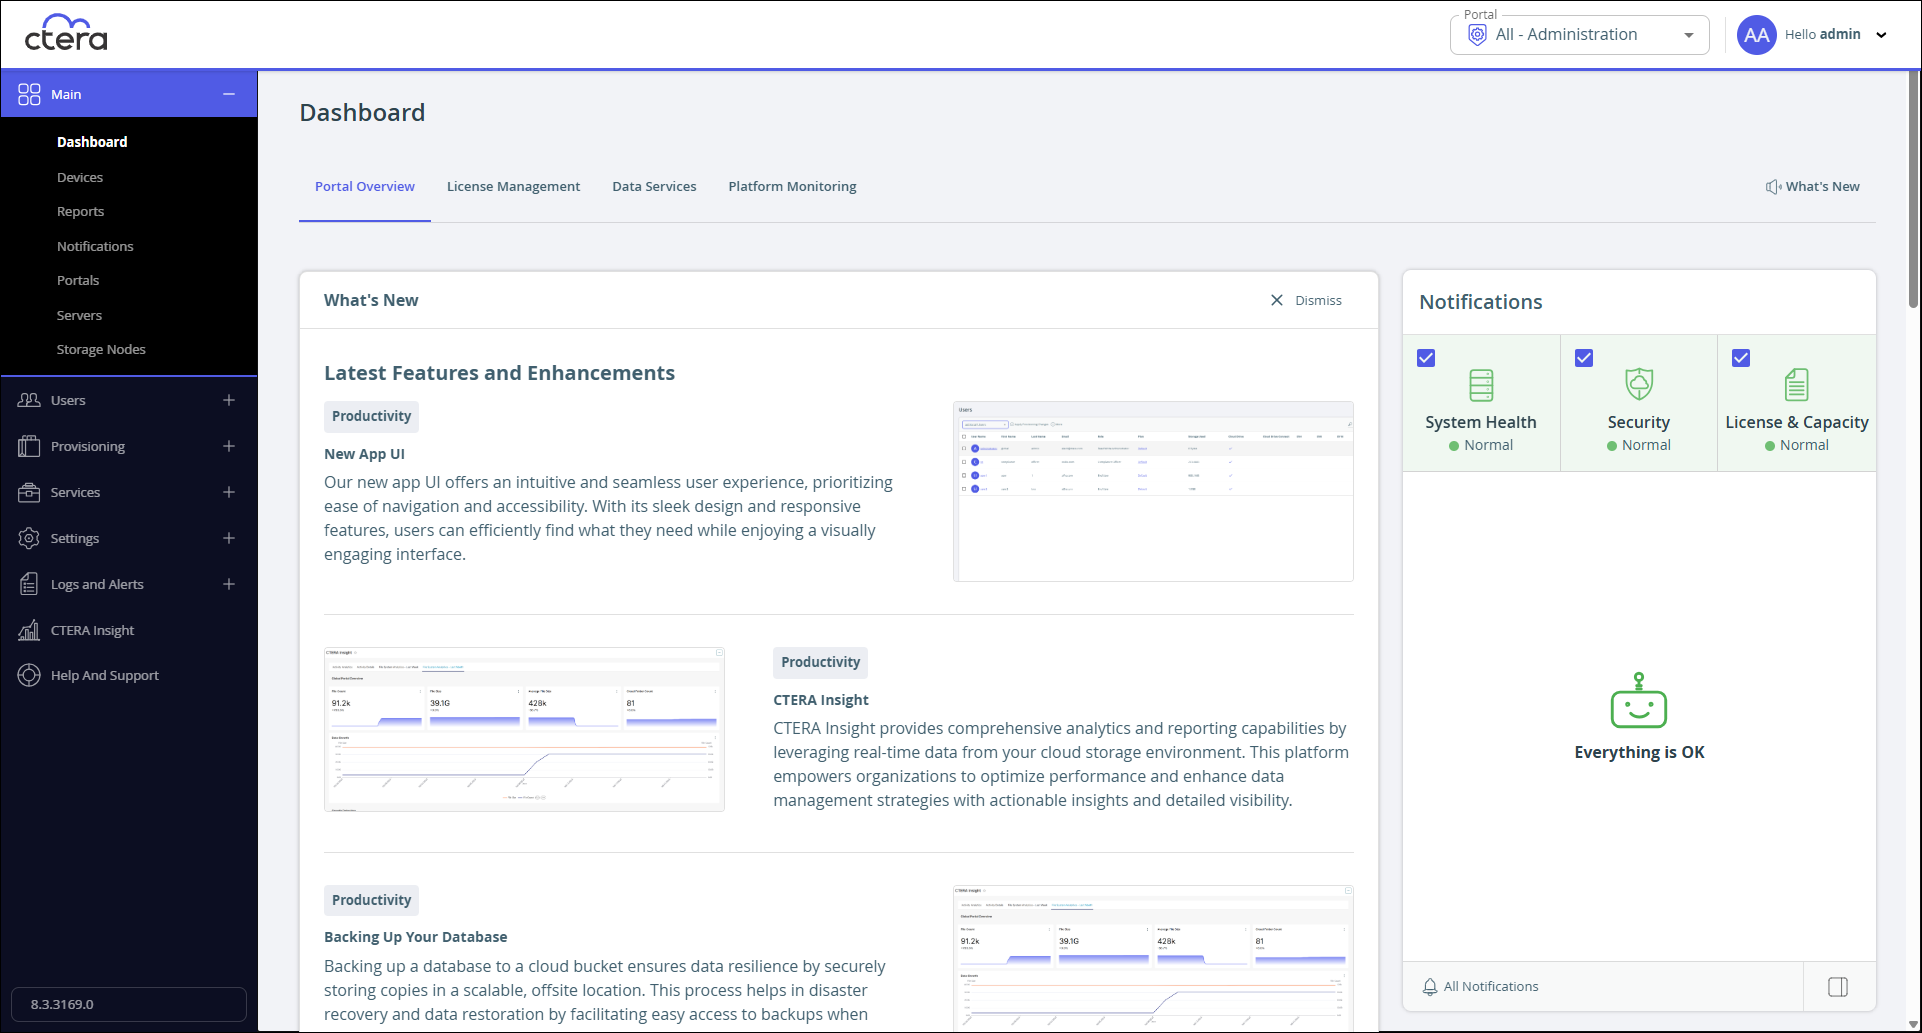
What's New
The dashboard initially displays what's new in this portal release.
To hide the What's New section, select Dismiss.
You can redisplay the What's New content by clicking What's New.
Users and Devices
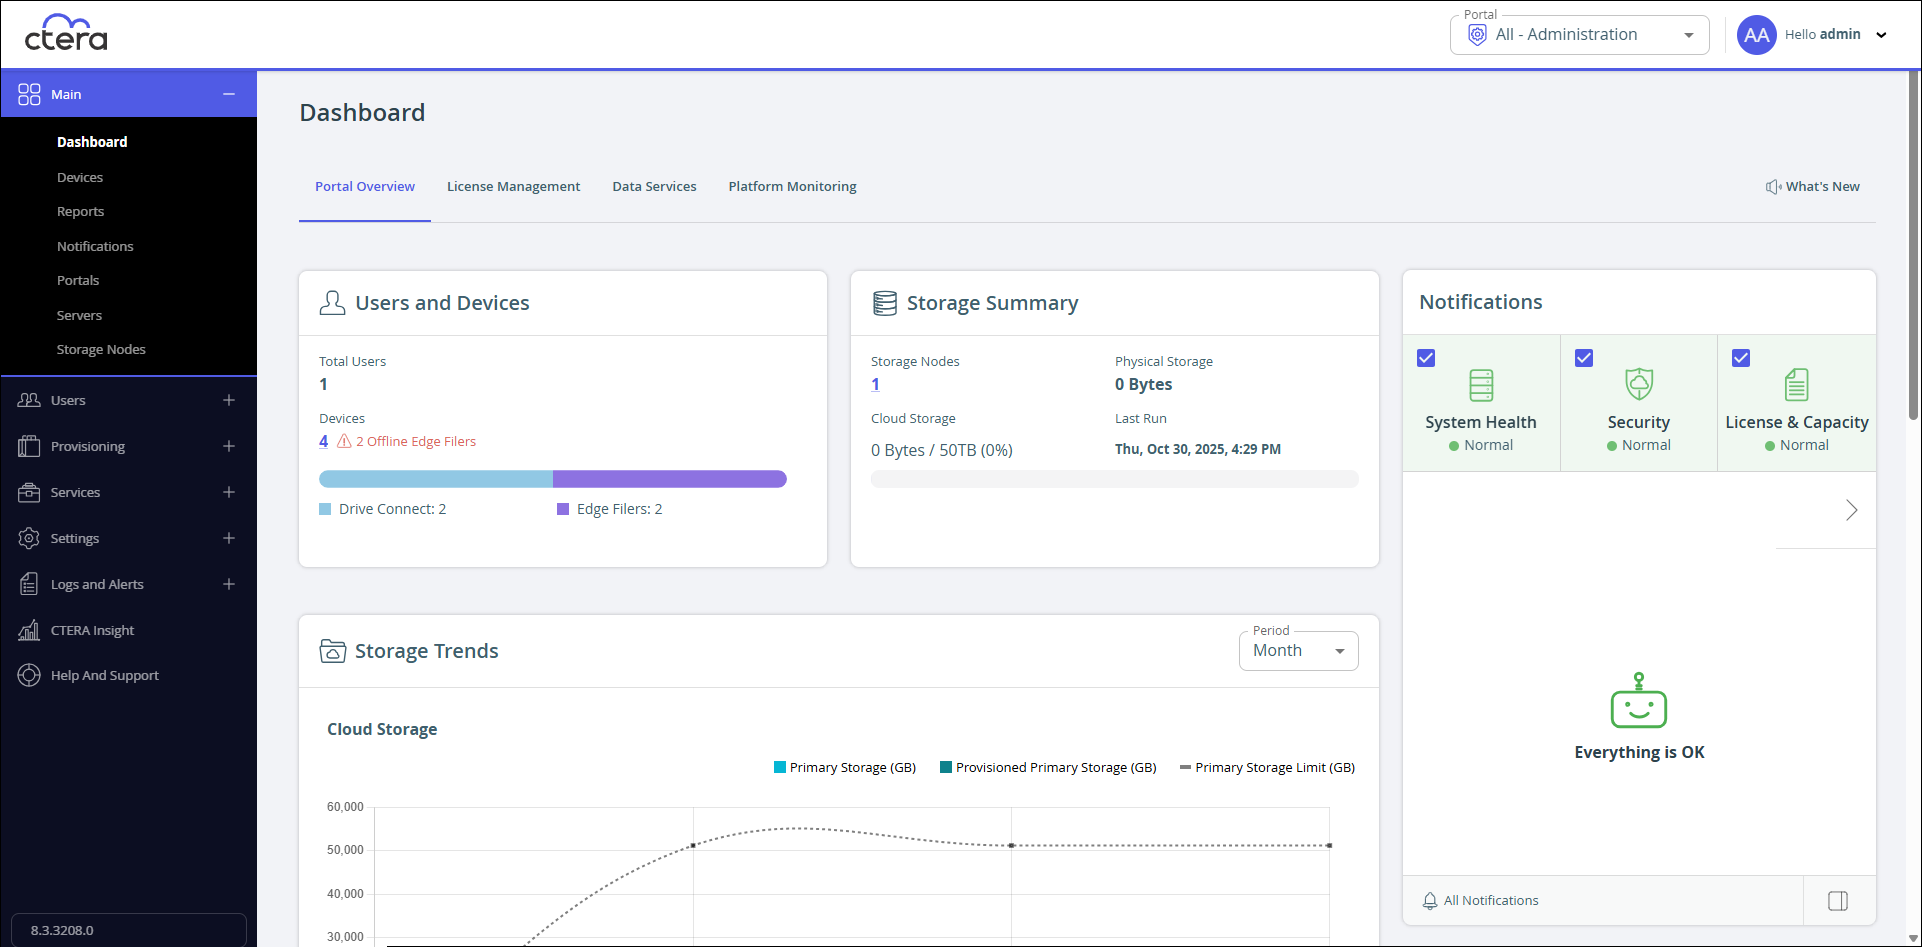
The dashboard displays users and devices registered on the portal.
Storage Summary
The number of storage nodes for the portal, the physical storage used, the cloud storage used, and the last time that the storage summary was generated. The summary is updated with the information from the storage reports.
Storage Trends
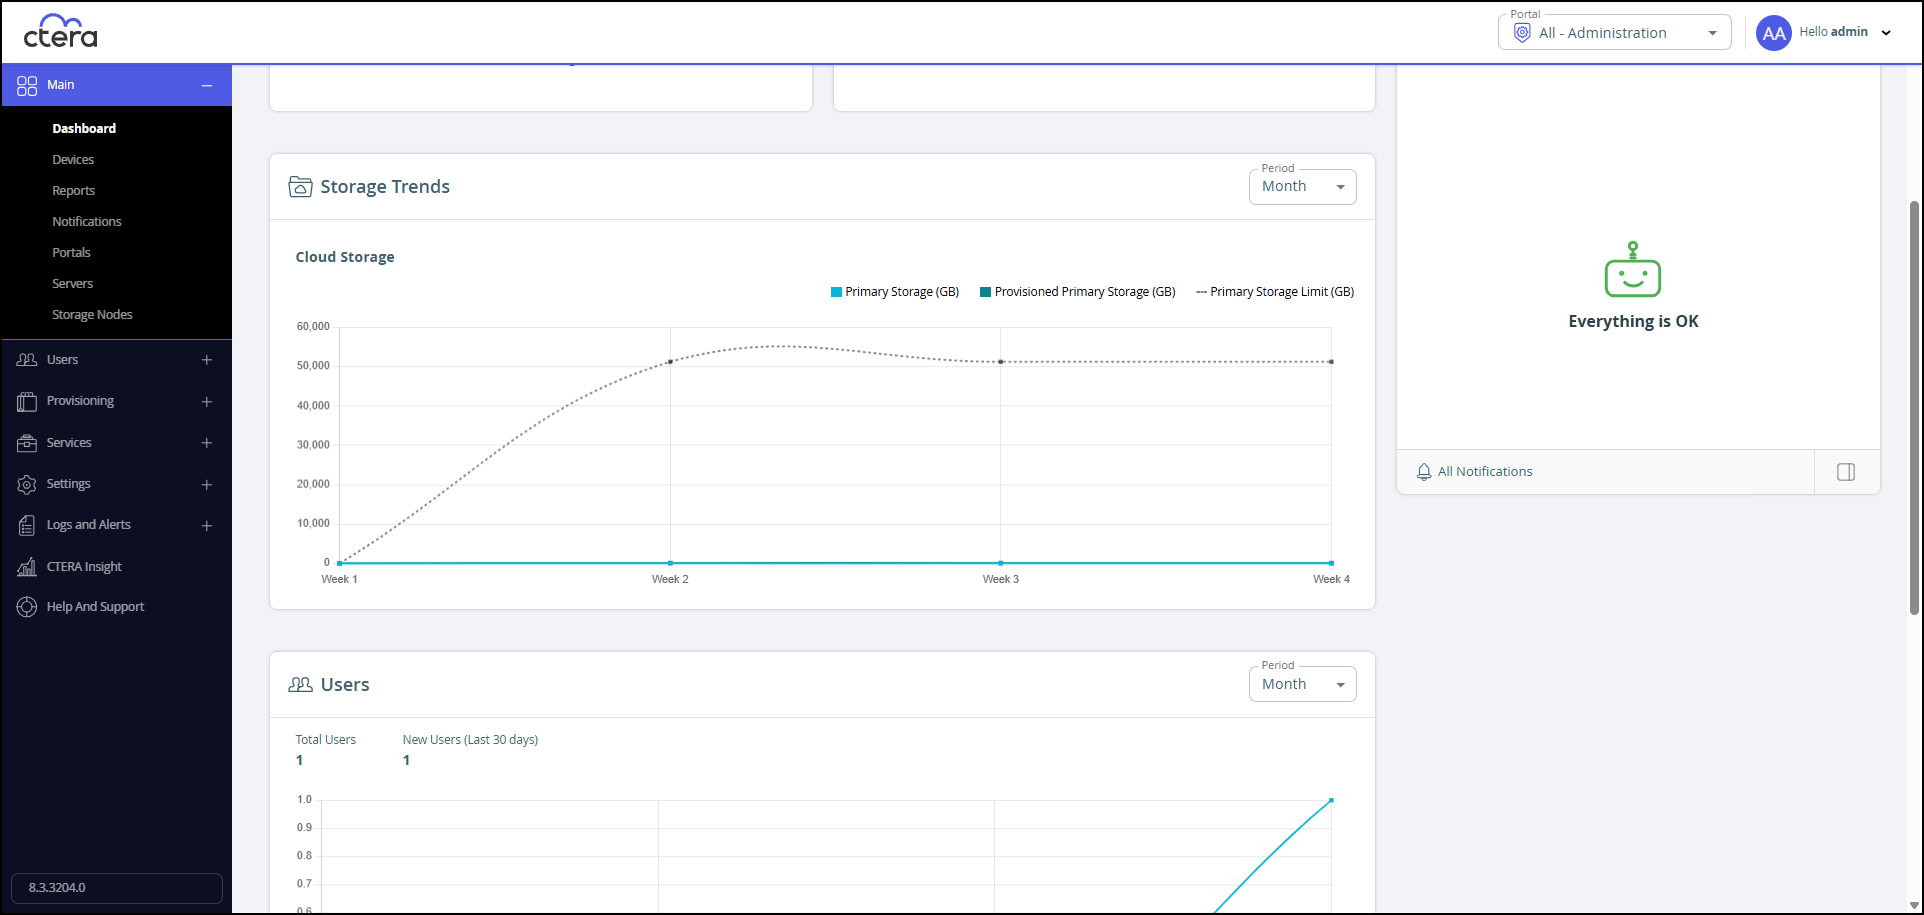
An overview of the Cloud Storage over time. In the Period drop down, select the time period display.
Users
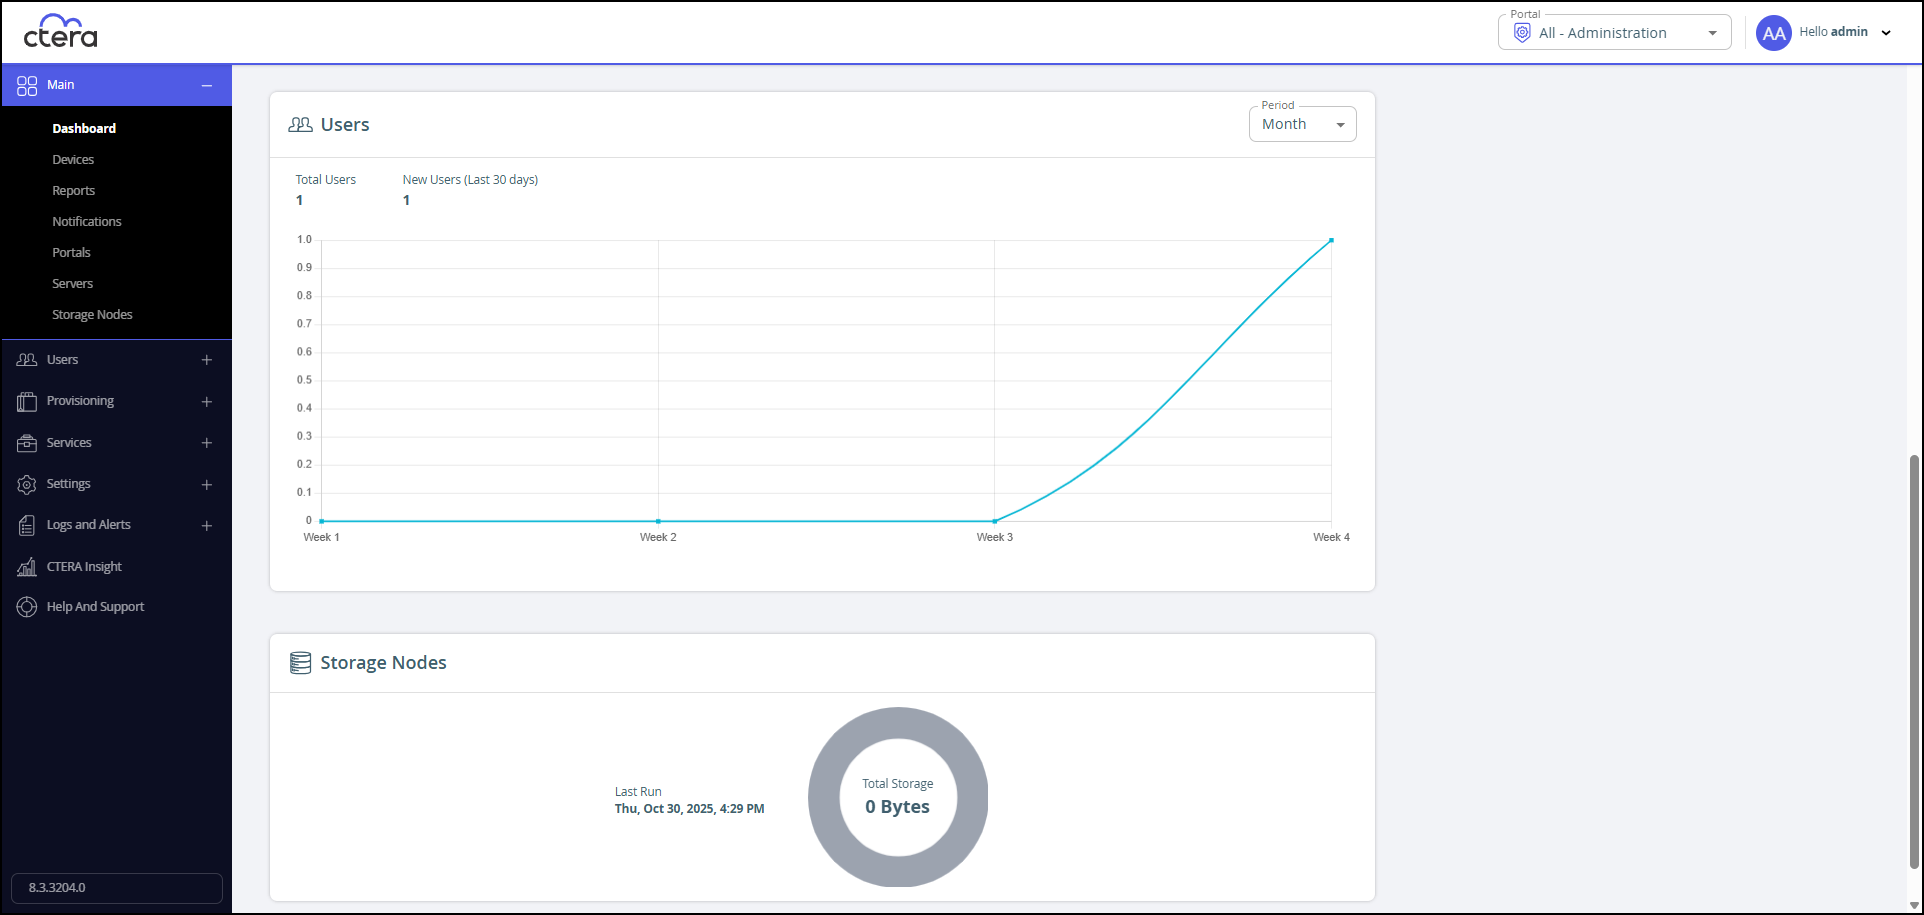
A summary of the number of users and new users over time. In the Period drop-down, select the time period to display.
Storage Nodes
A holistic view of the total storage used and the last time that the storage summary was generated.
License Management
The License Management tab displays an overview of licenses and the license trends.
Licenses Overview
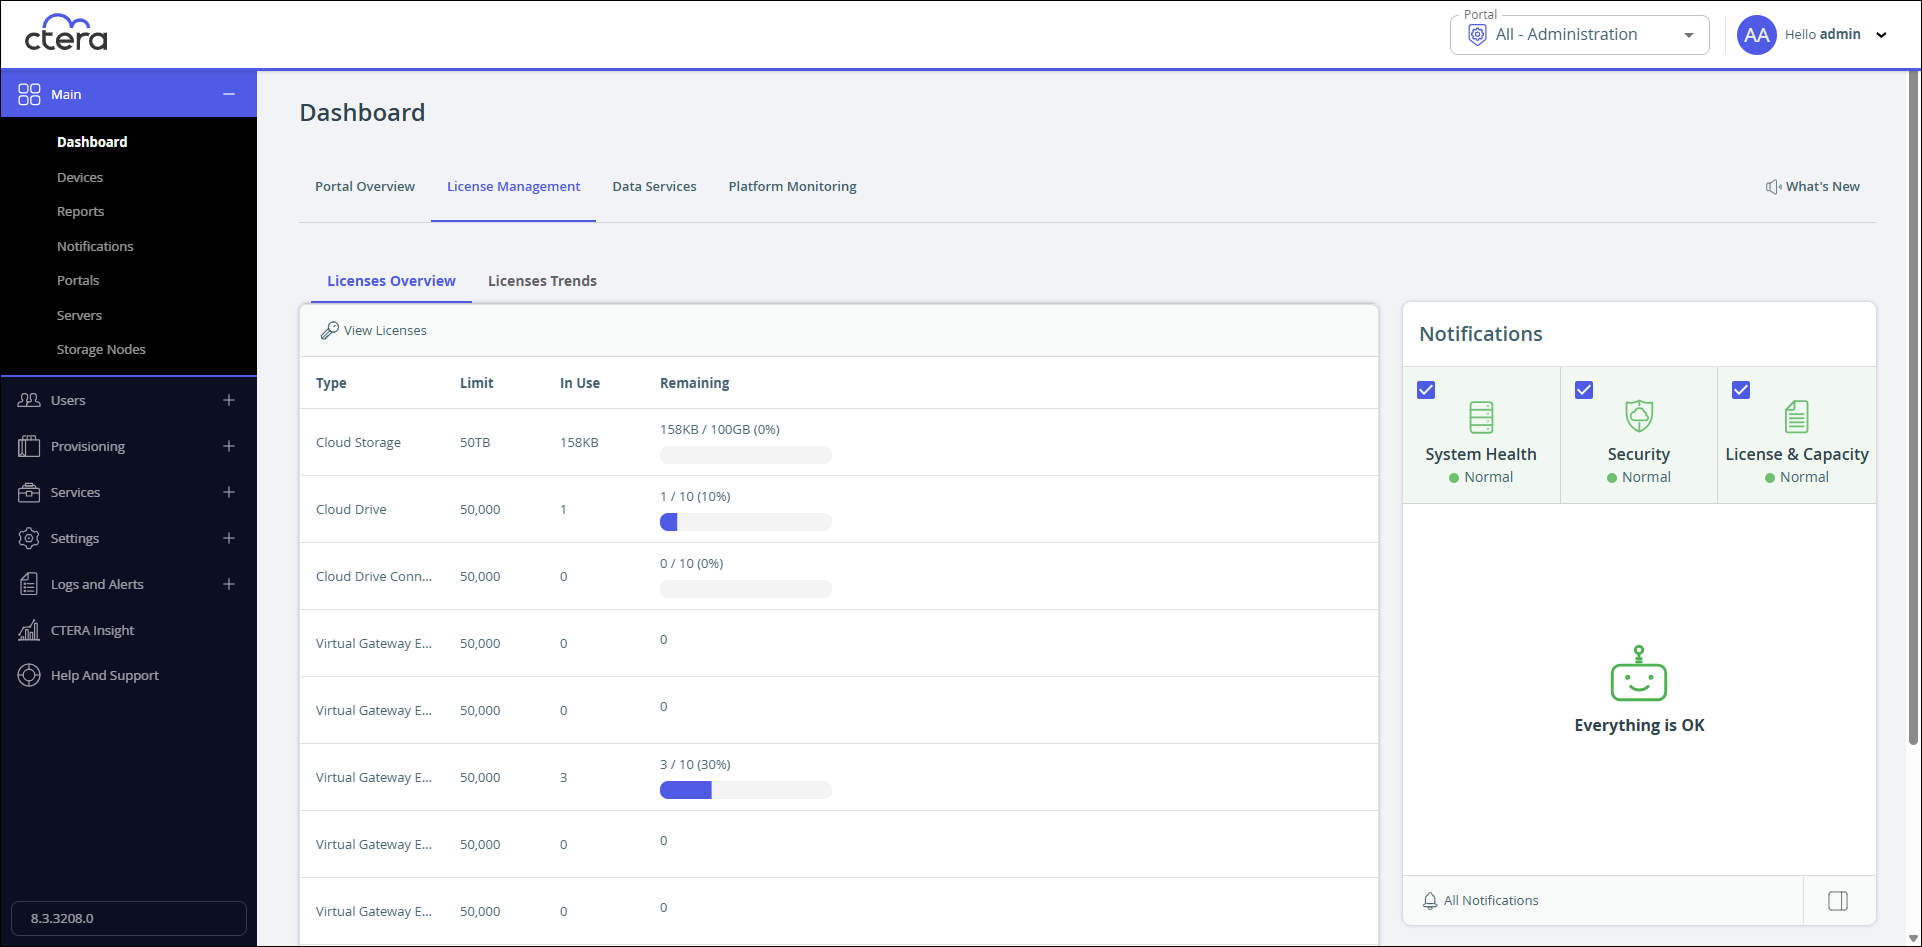
A summary of each license, what is licensed and the license quotas and current use and what is remaining.
Click View Licenses to display the License page.
Licenses Trends
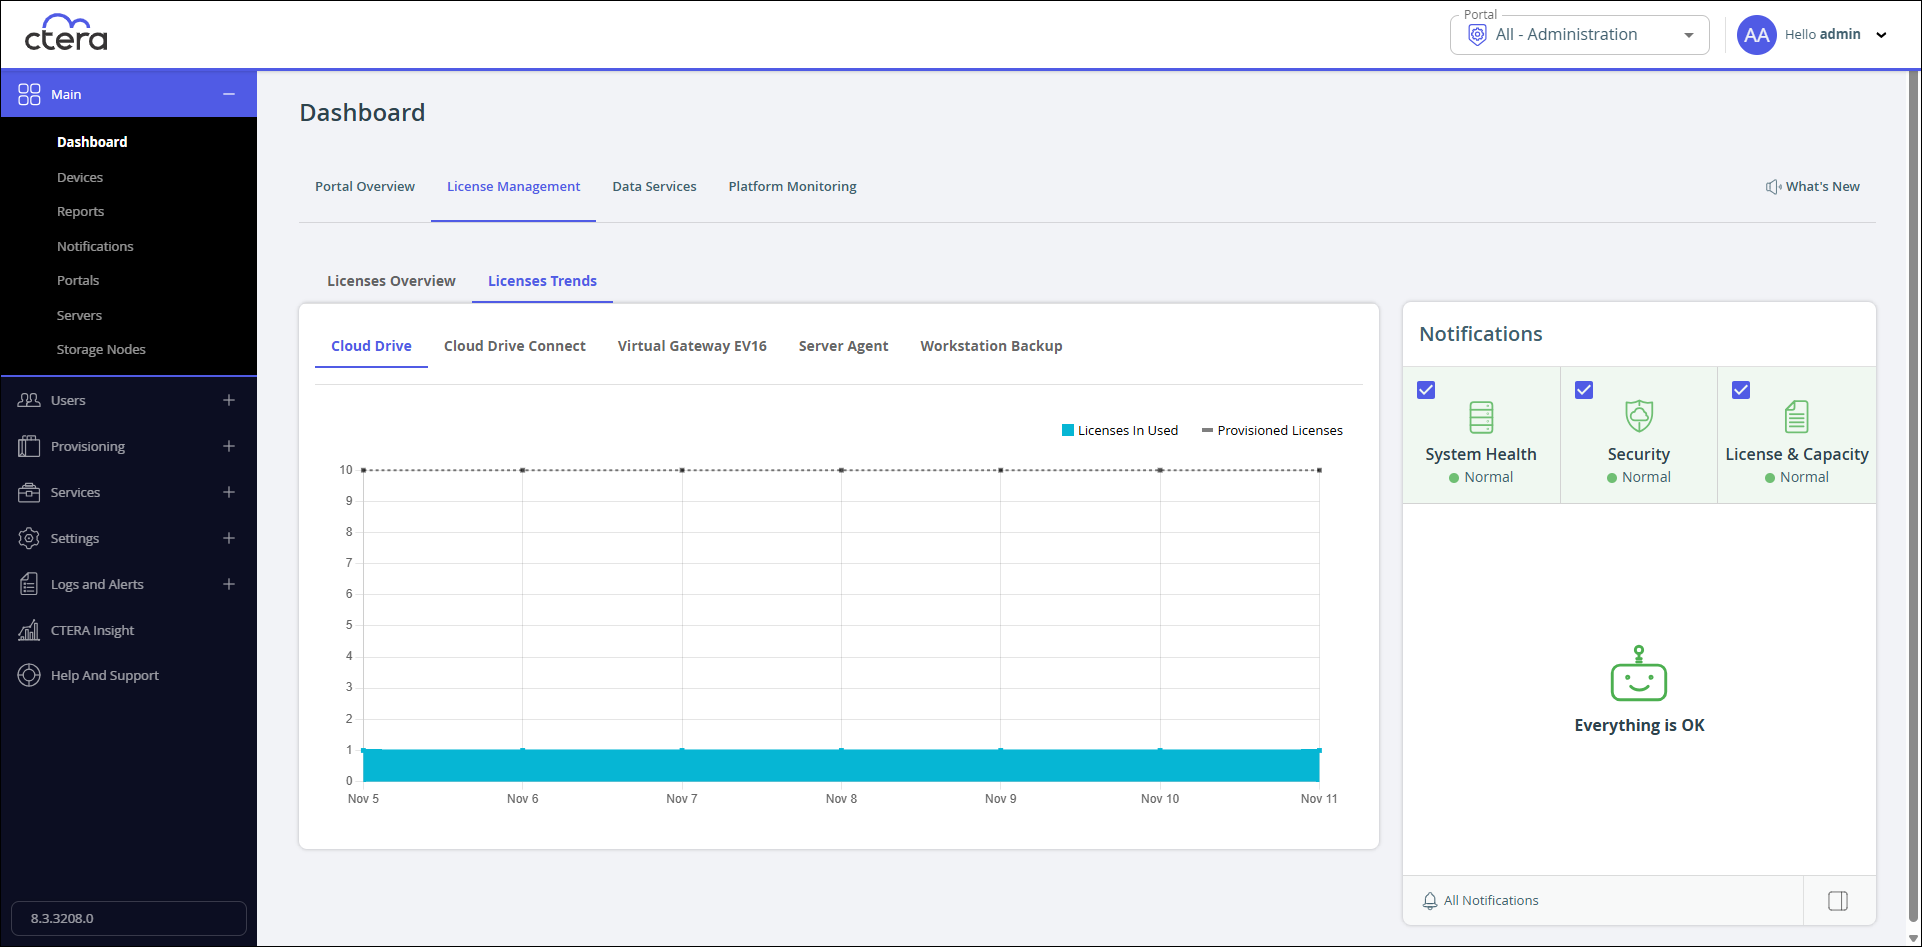
License usage over the last week showing both the provision licenses and actual licenses in use and the provisioned licenses.
Data Services
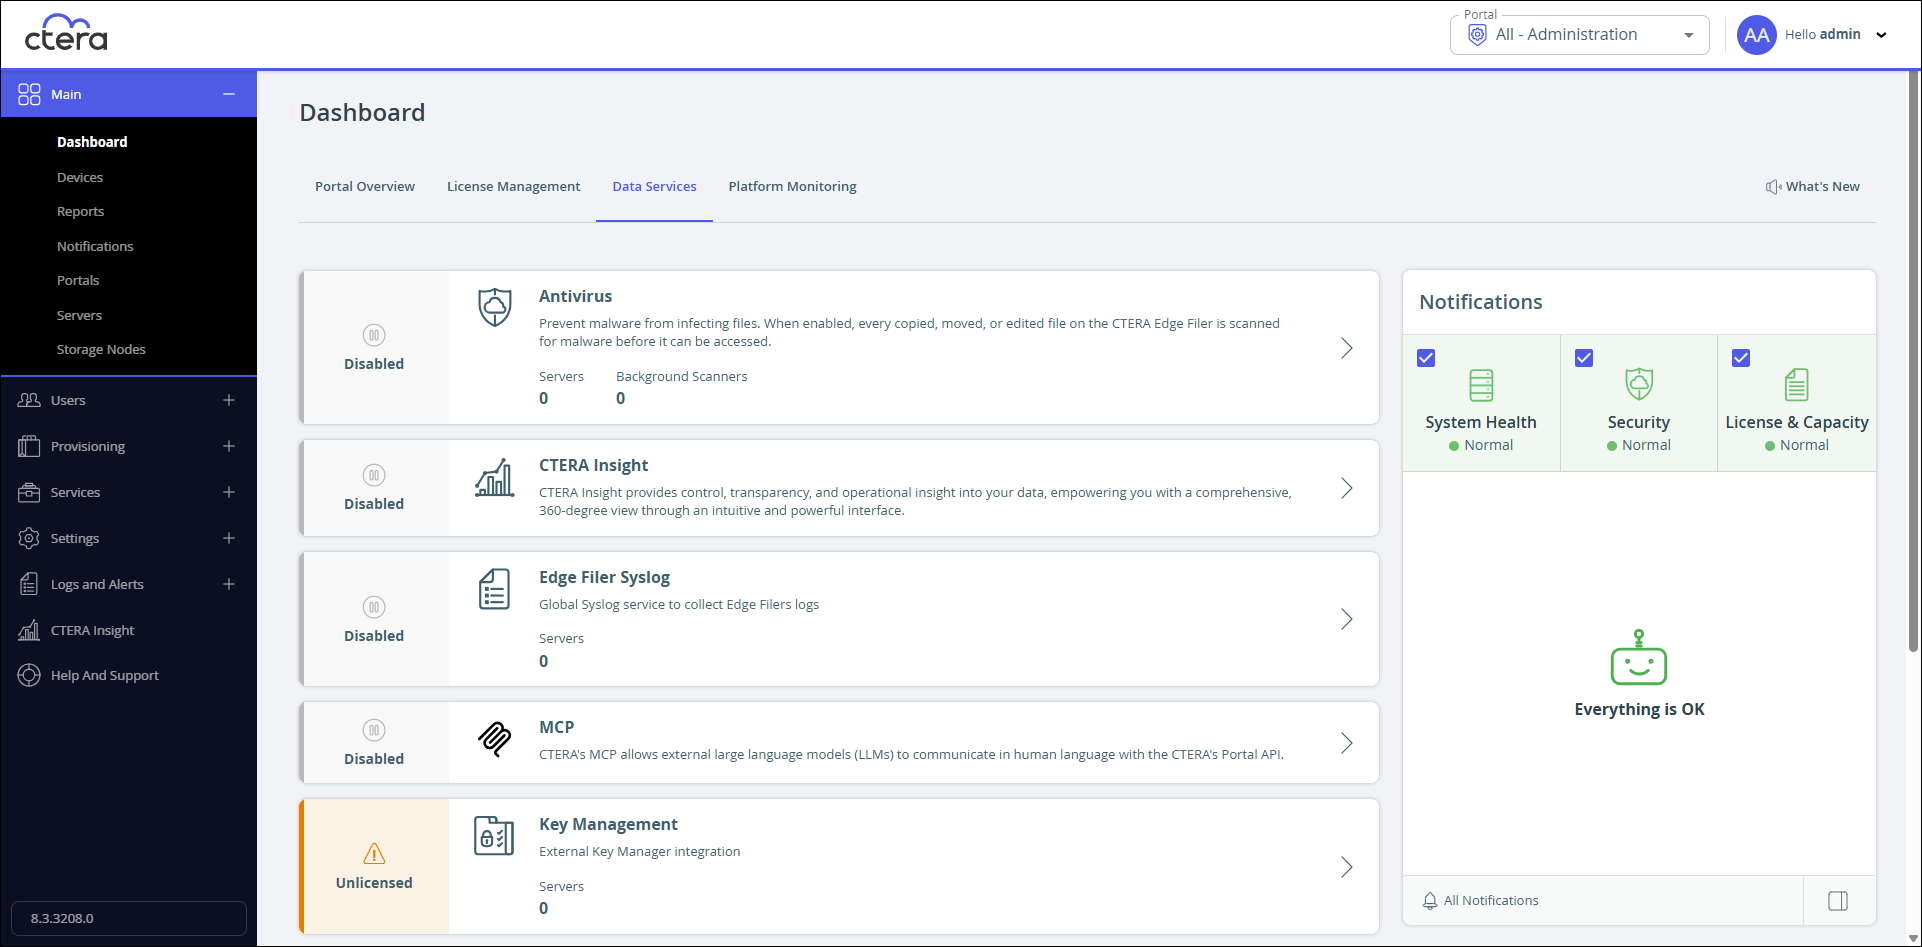
The status and activity of the data services. Clicking > to the right of a service displays the service page. For example, clicking > for the Antivirus service displays the Antivirus page.
Platform Monitoring

Real-time metrics per server for live monitoring. Select the server in the portal cluster to monitor from the Server drop-down.

Server
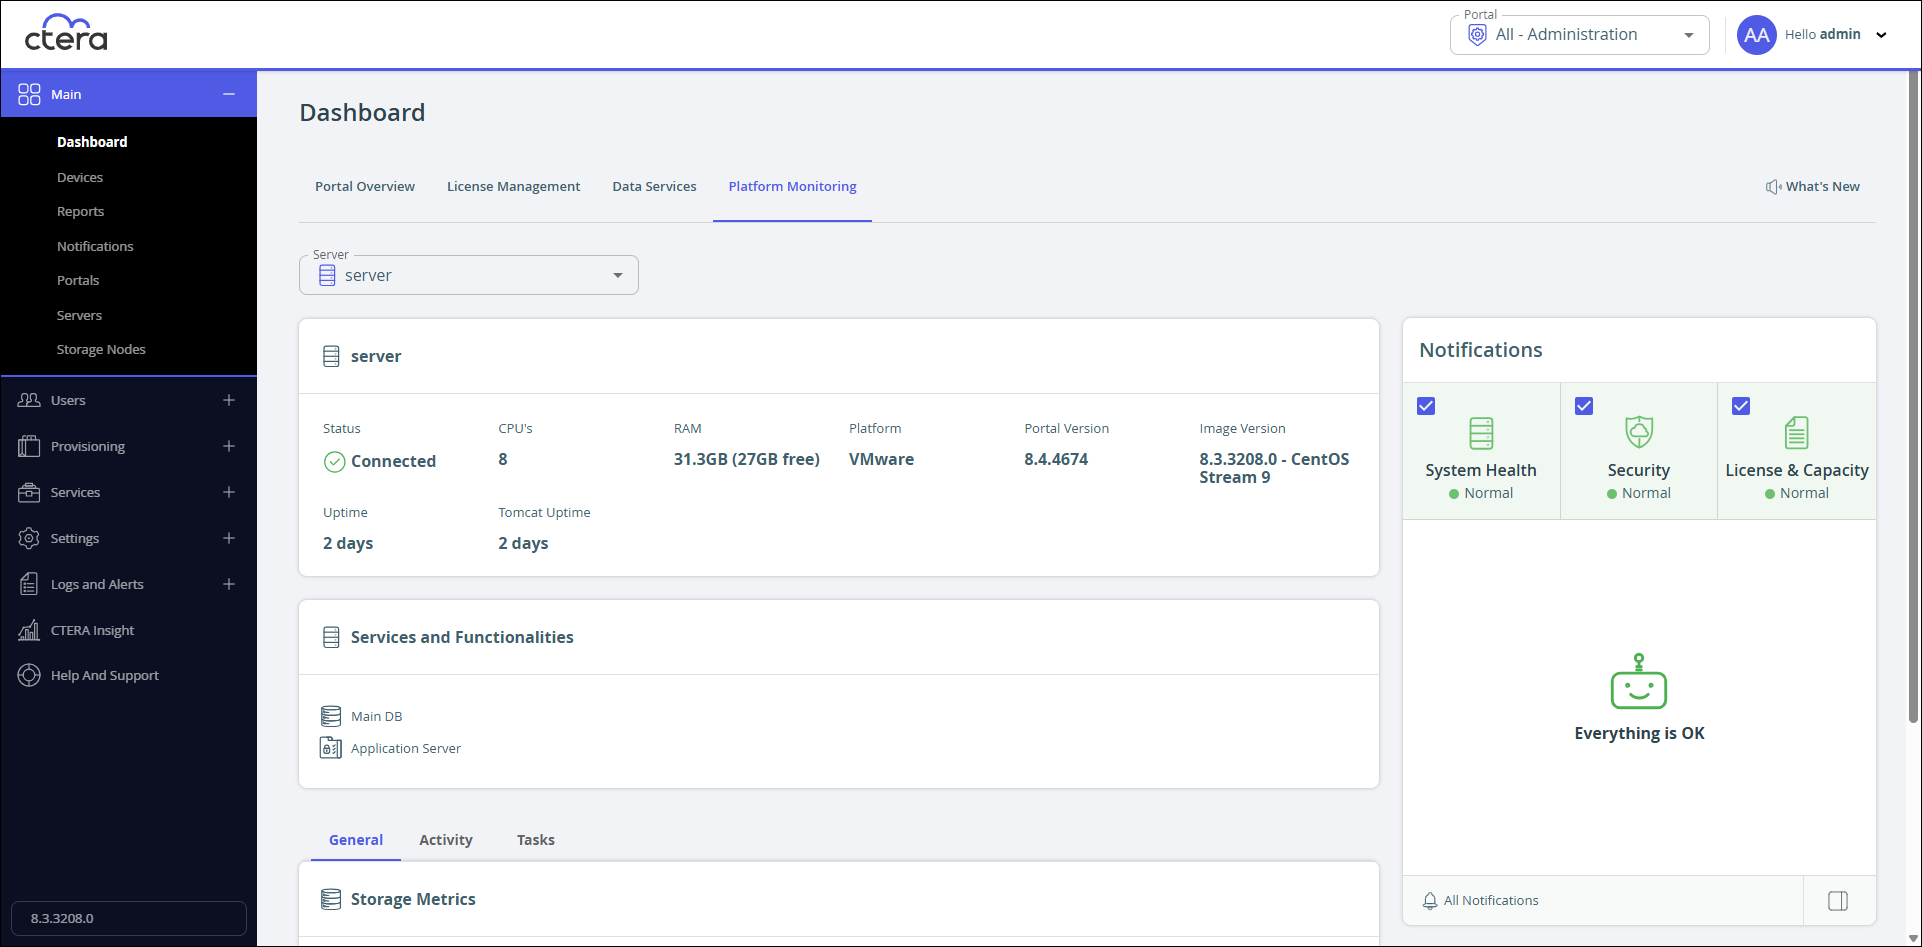
Displays status information about the selected server, including the software and image versions, and how long the server has been running.
Services and Functionalities
The services and functionalities set for the selected server. For details, see Editing Server Settings.
At the bottom of the Platform Monitoring tab are additional tabs: General, Activity, and Tasks.
General
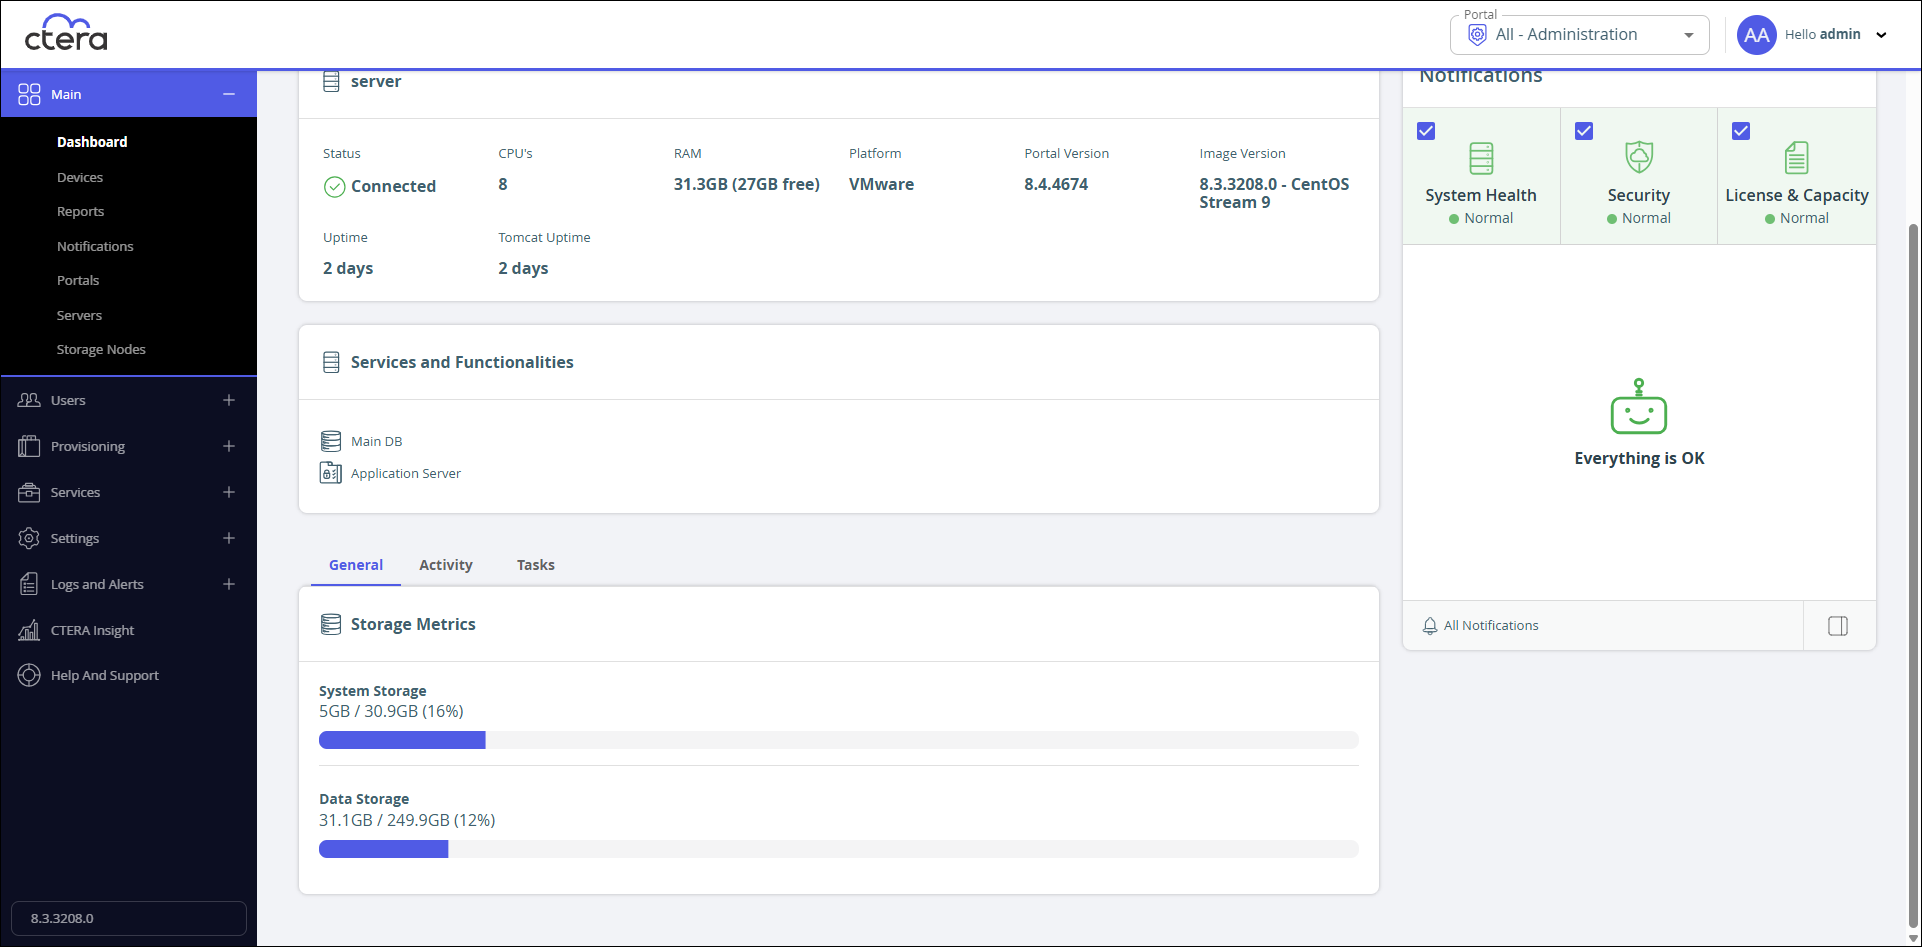
The percentage of both the system and the data storage used.
Activity
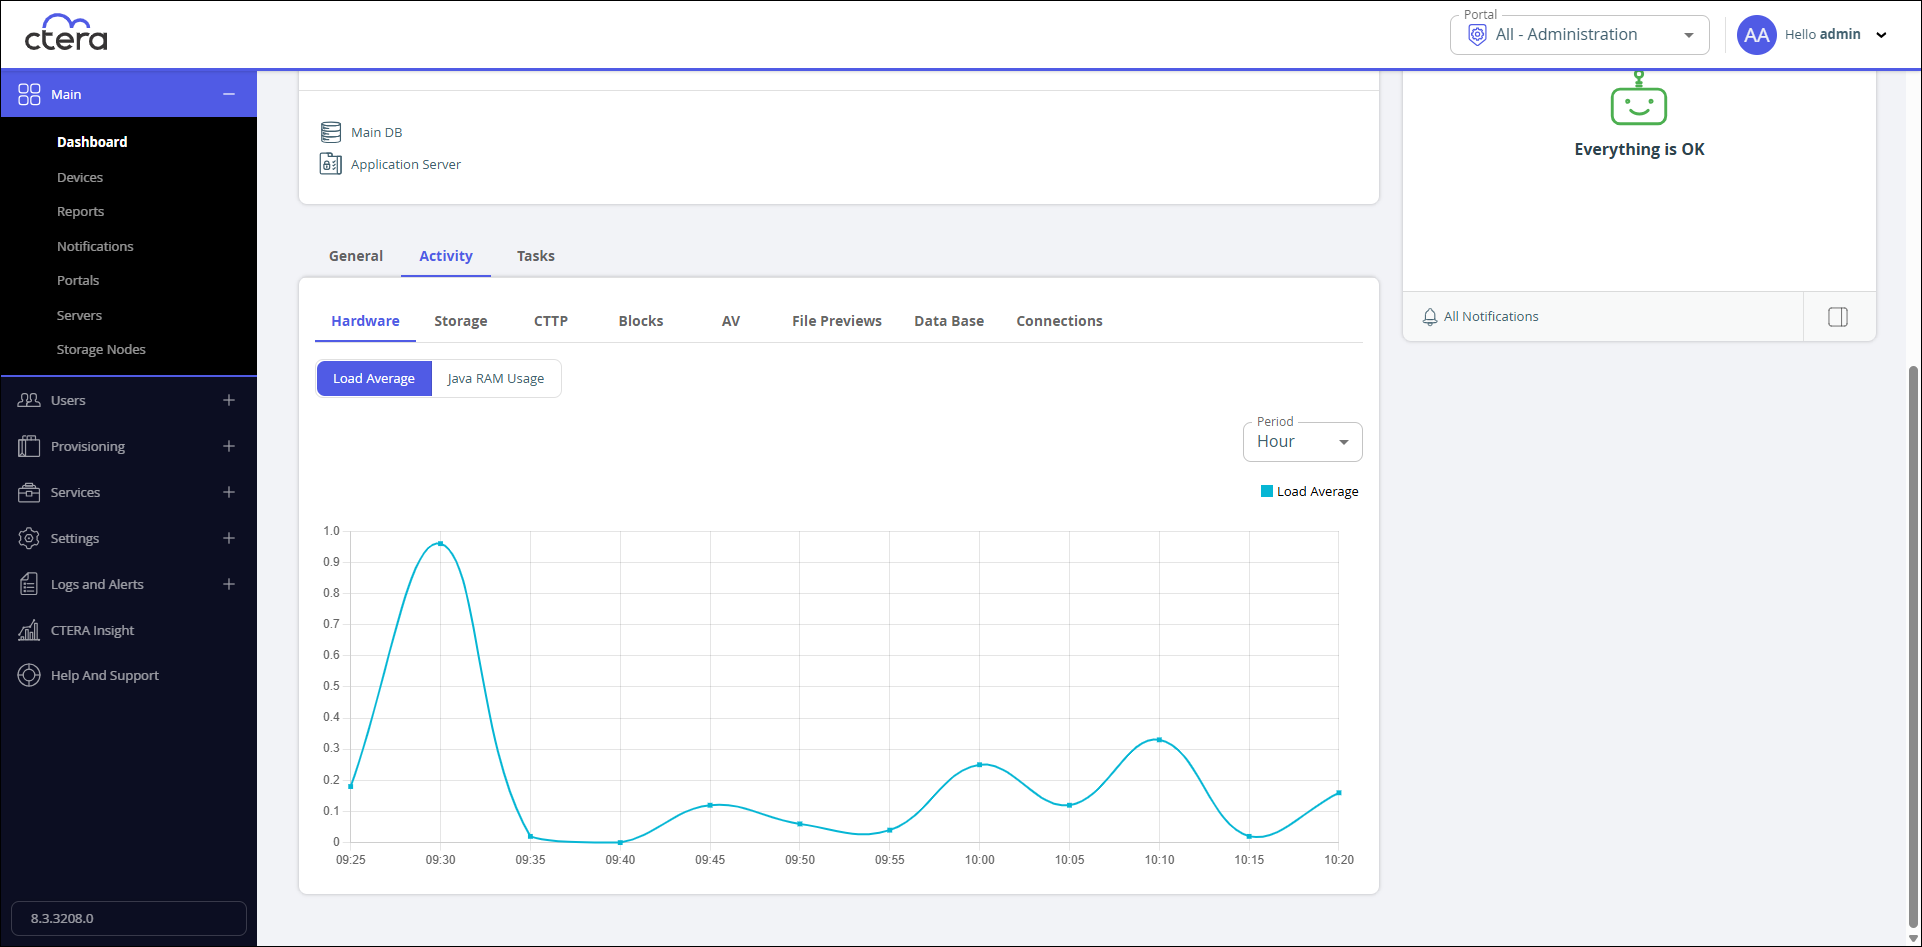
You can view charts displaying a server's activity data.
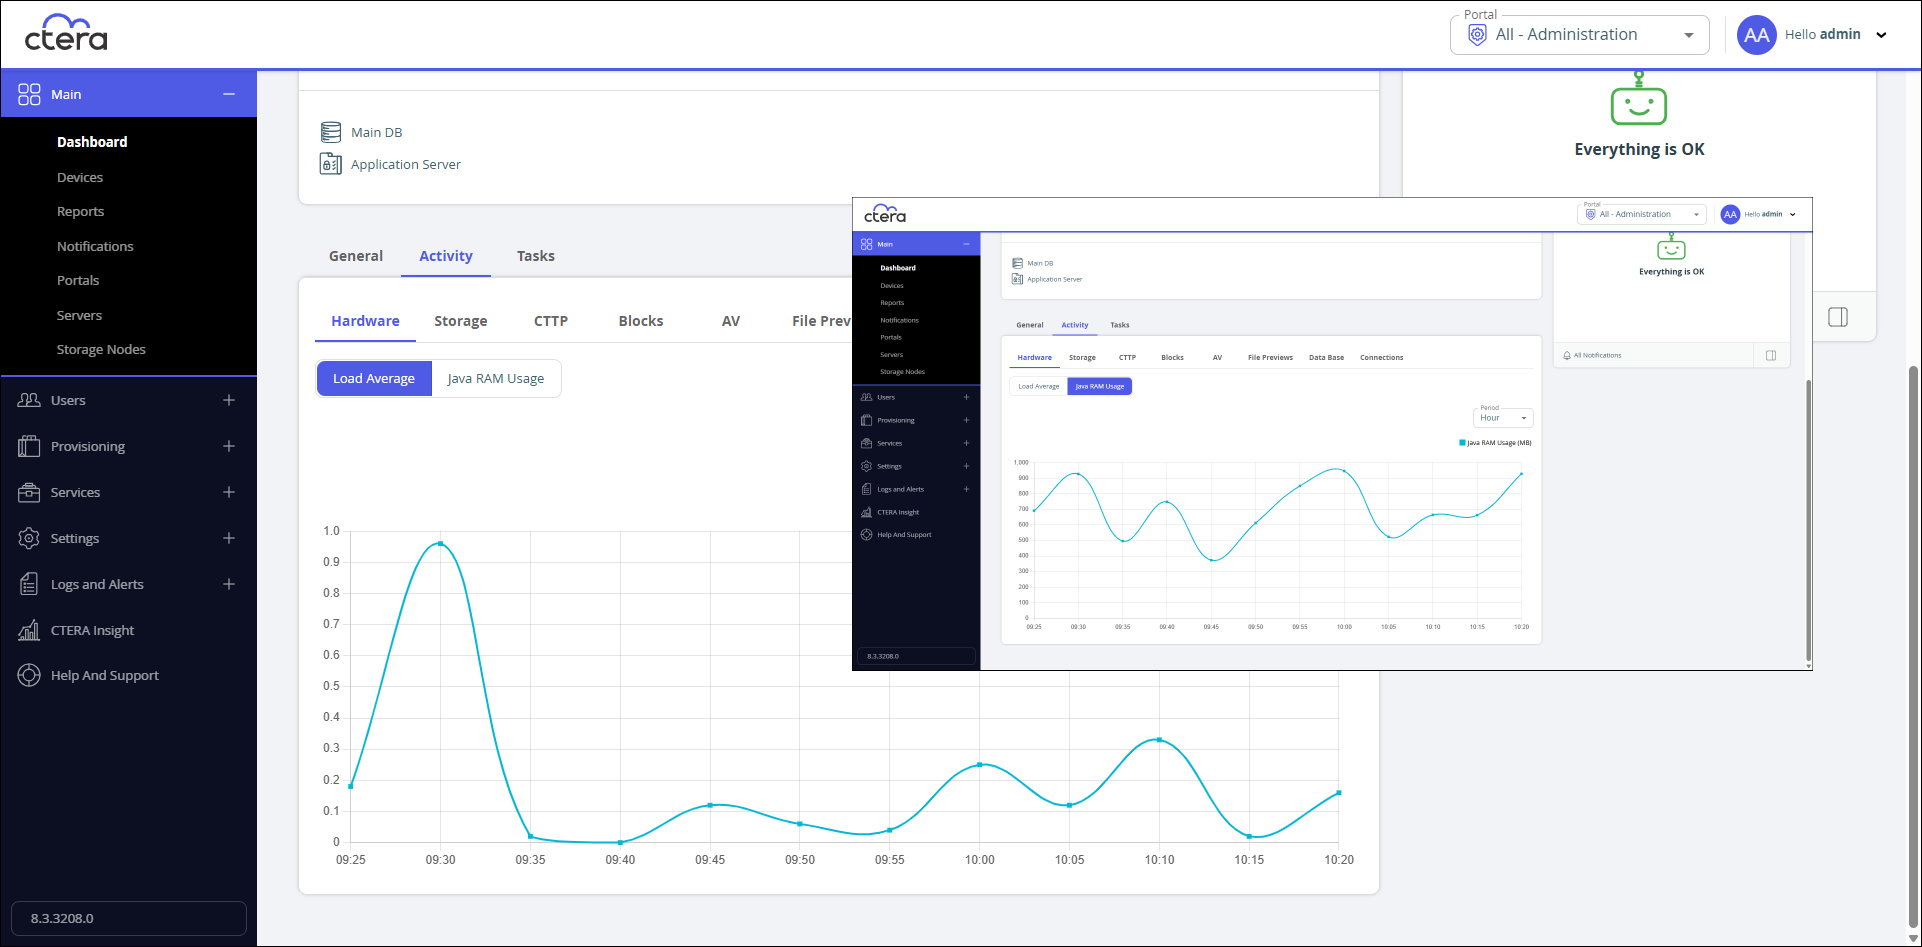
Hardware
Load Average – The server's average load over time. A server's load is the number of currently running processes that are using, or waiting to use, the CPU.
Java RAM Usage – The server's Java RAM usage in MB over time.
Storage
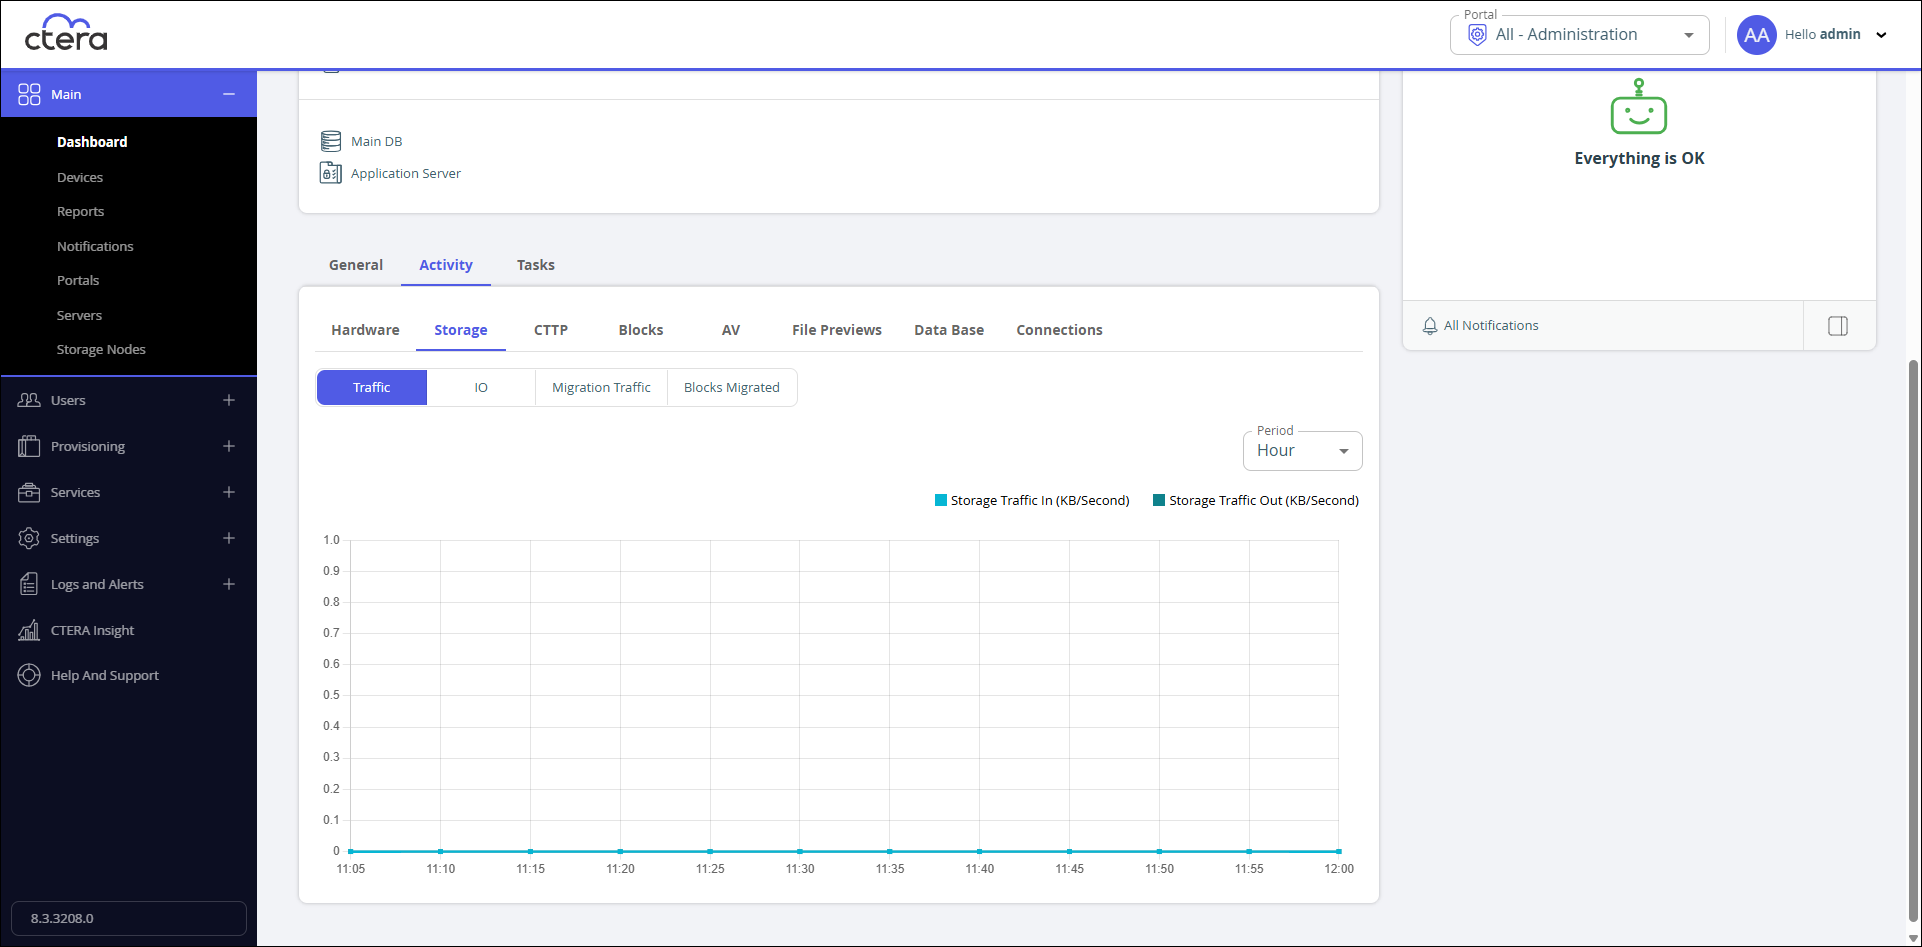
Traffic – The incoming and outgoing storage traffic over time.
IO – The number of read and write operations performed by the CTERA Portal on cloud storage nodes.
Migration Traffic – The amount of storage node migration traffic.
Blocks Migrated – The number of blocks migrated in storage node migration.
CTTP
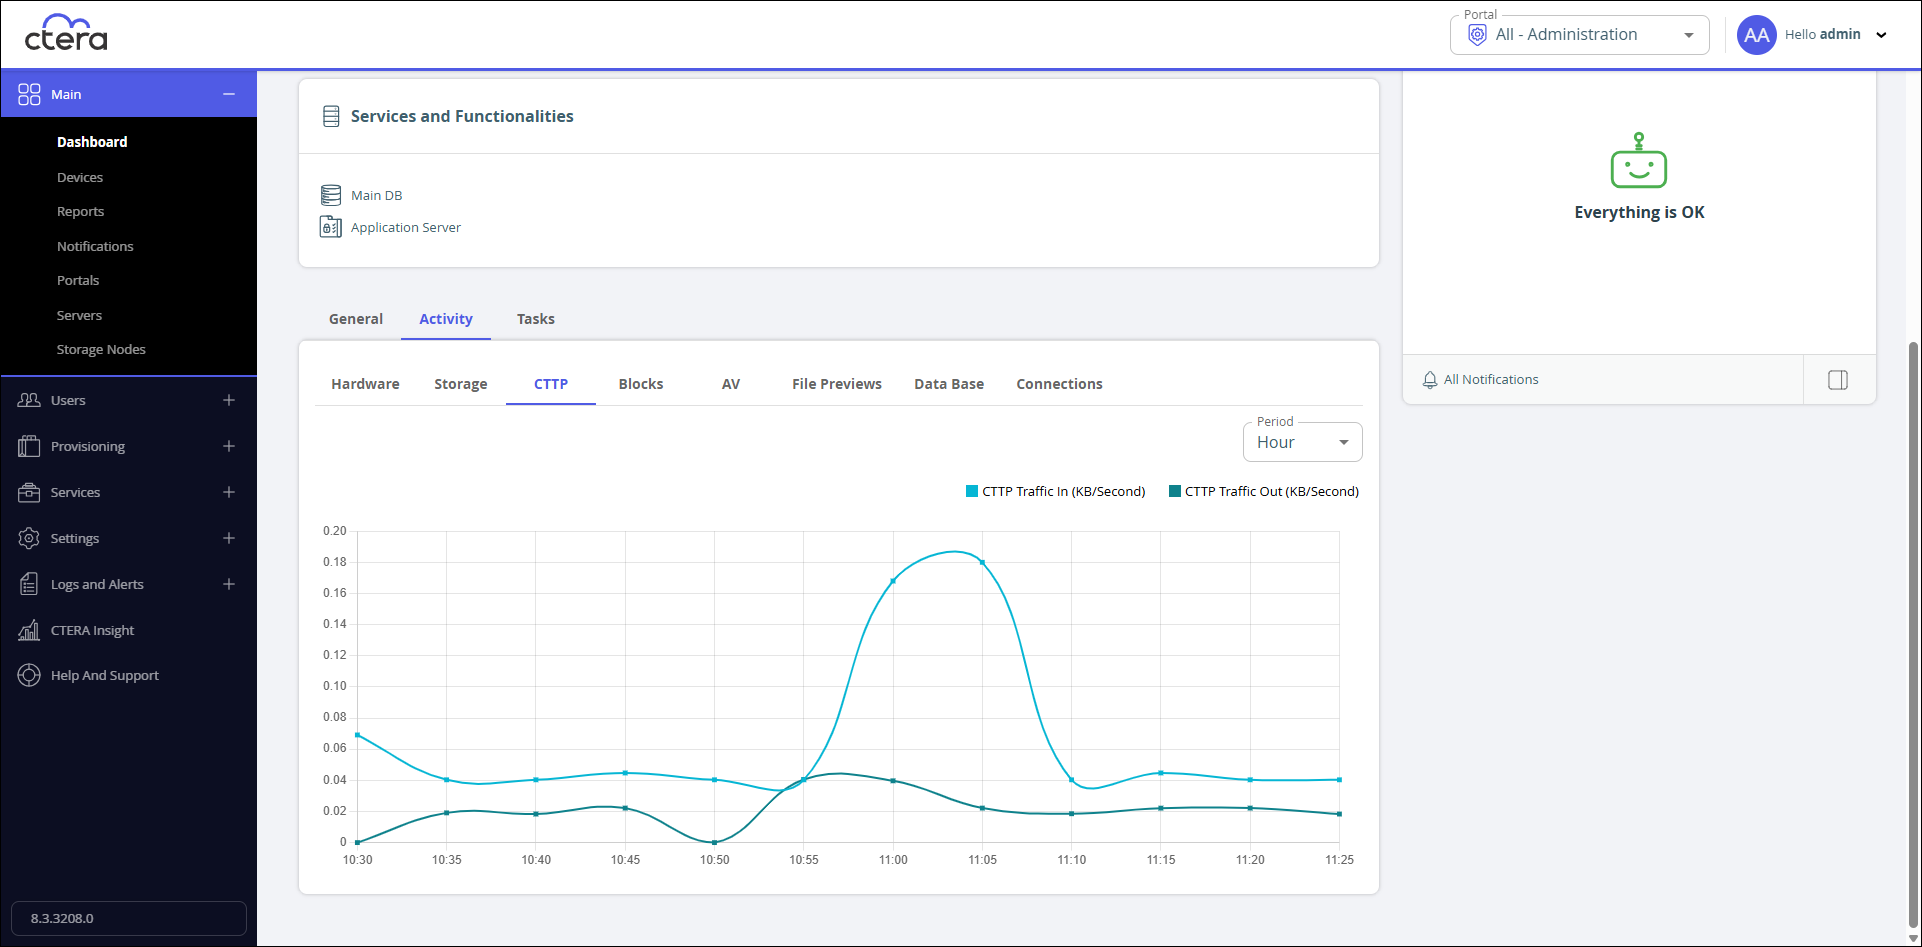
The inbound and outbound CTTP traffic over time.
Blocks
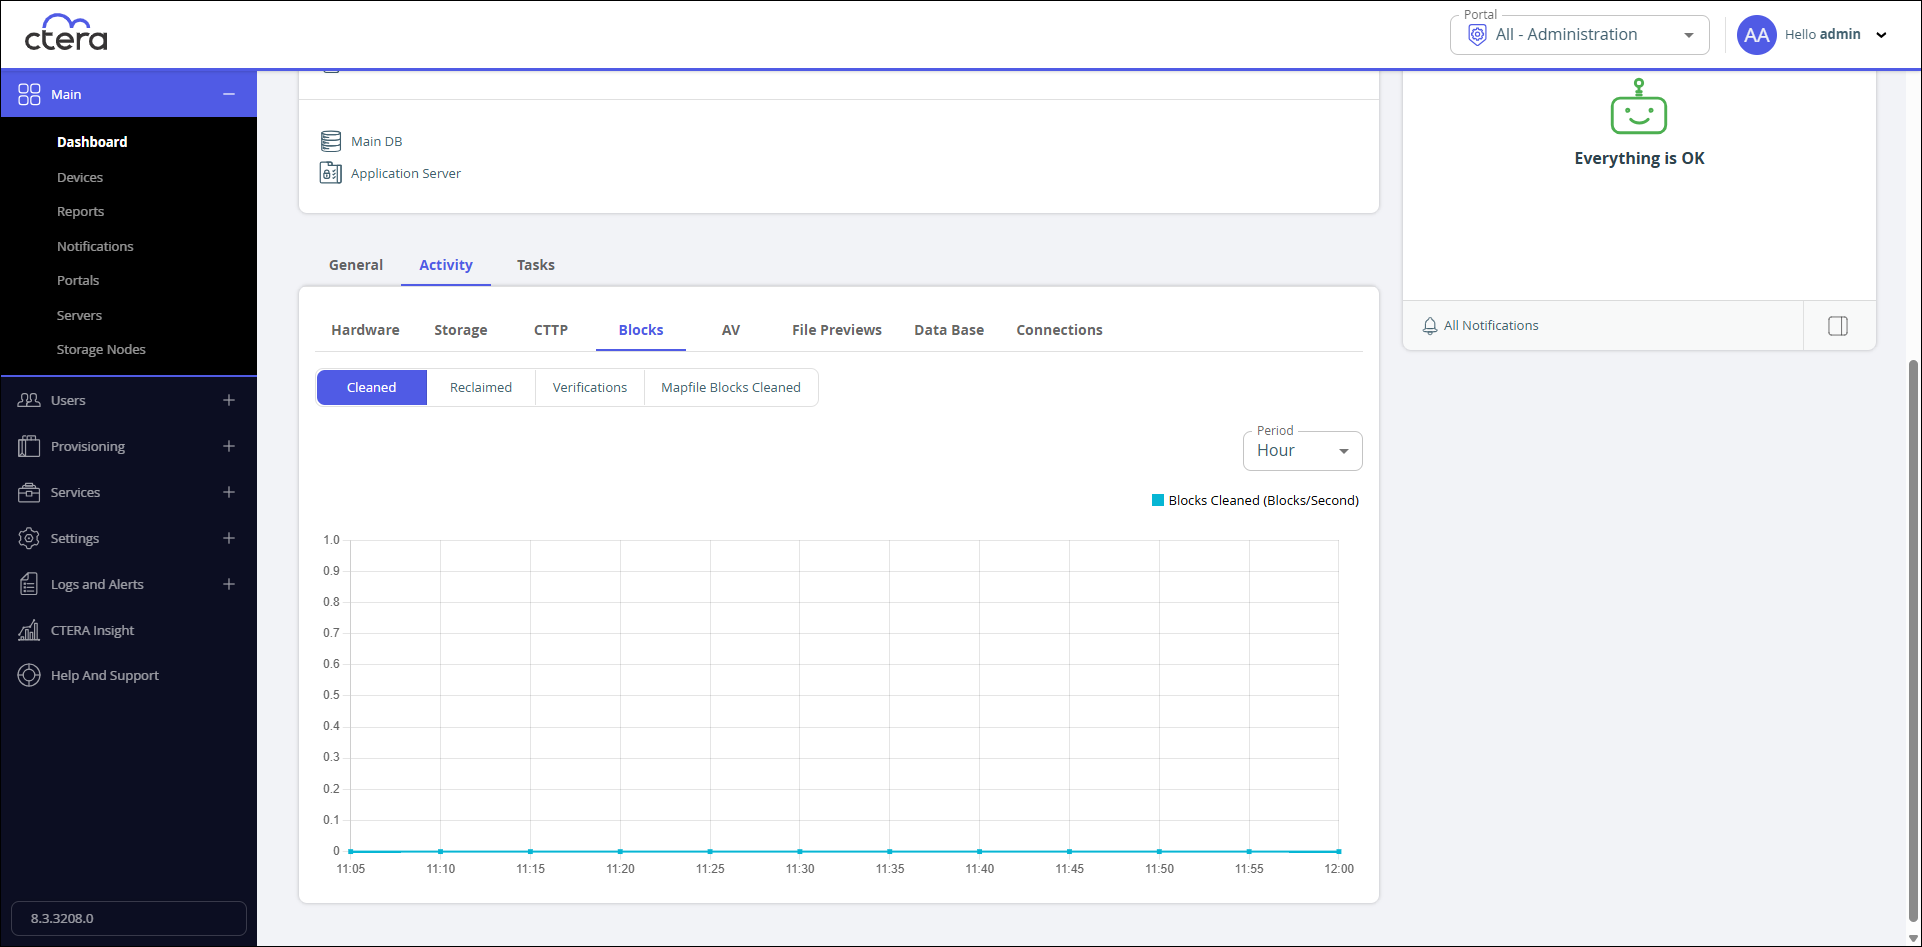
Cleaned – The number of blocks cleaned per second, as part of system maintenance.
Reclaimed – The number of blocks deleted per second, as part of system maintenance.
Verifications – The number of block verifications per minute. Block verifications are executed when the portal is executing a consistency check as part of system maintenance.
- Mapfile Blocks Cleaned – The number of mapfile blocks cleaned per second, as part of system maintenance.
AV
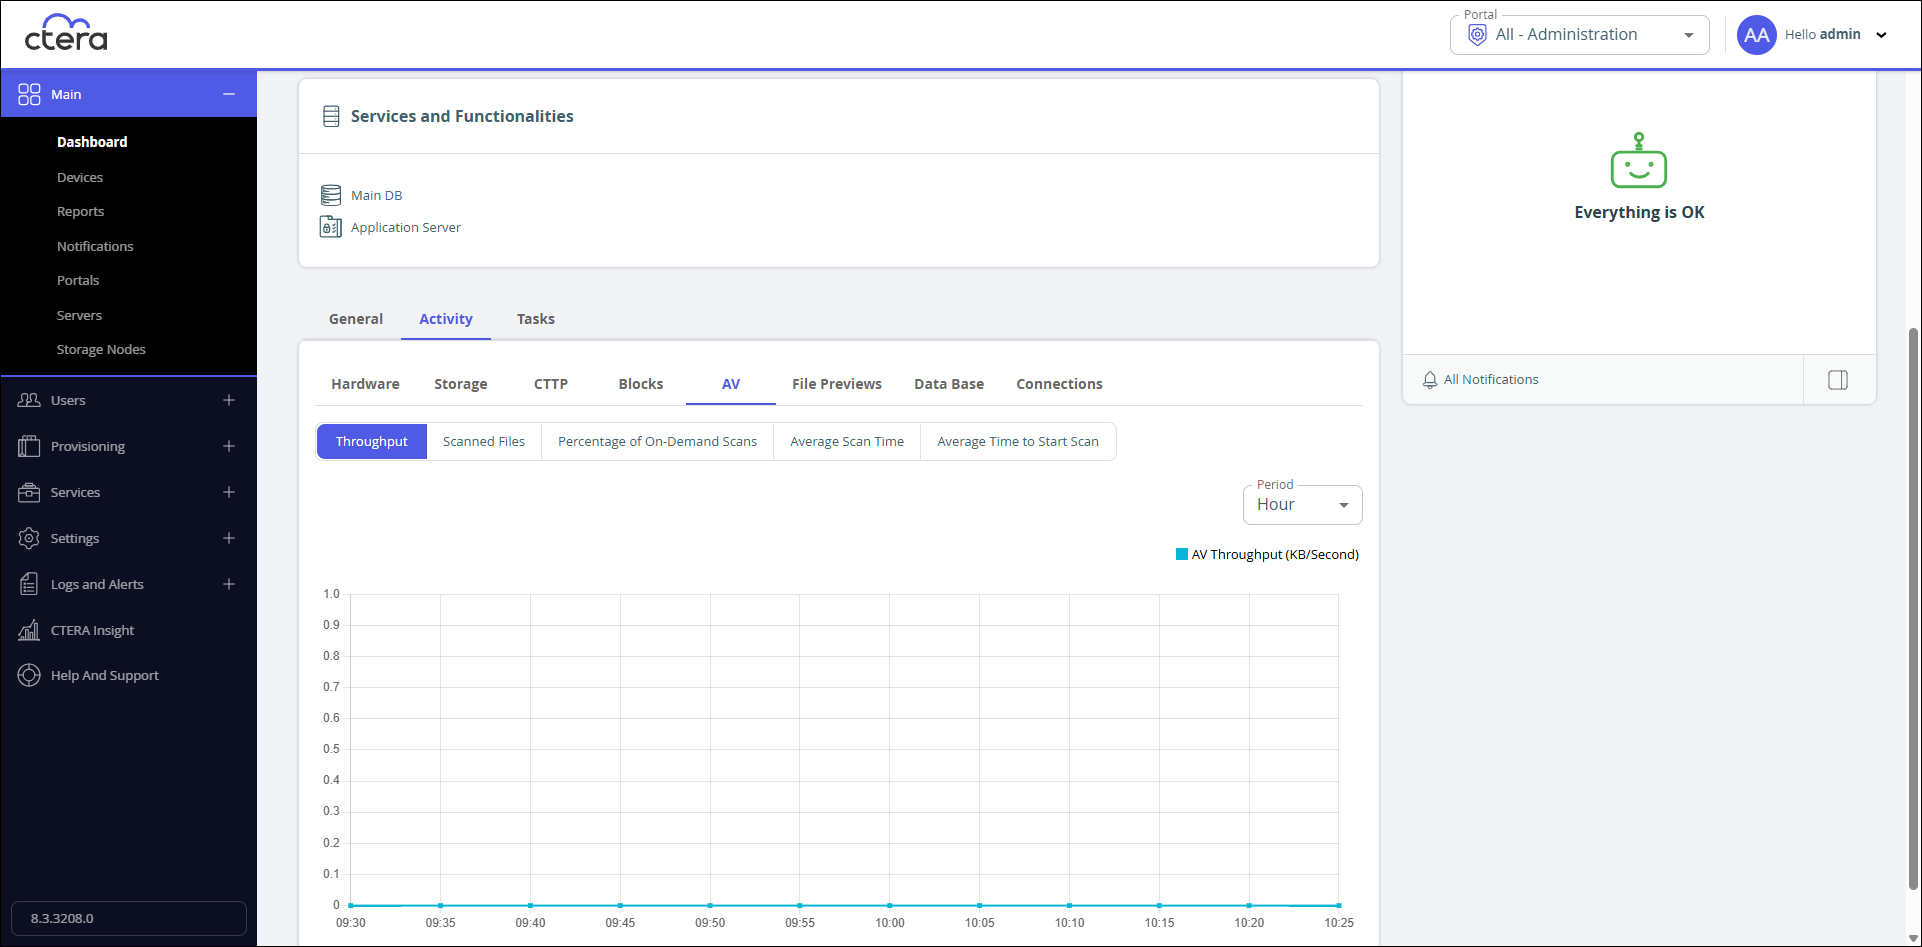
Throughput – The amount of throughput by Cloud Drive antivirus.
Scanned Files – The number of files scanned by Cloud Drive antivirus.
Percentage of On-Demand Scans – The percentage of files scanned on demand.
Average Scan Time – The average time a scan takes.
Average Time to StartScan – The average amount of time it takes for a scan to start.
File Previews
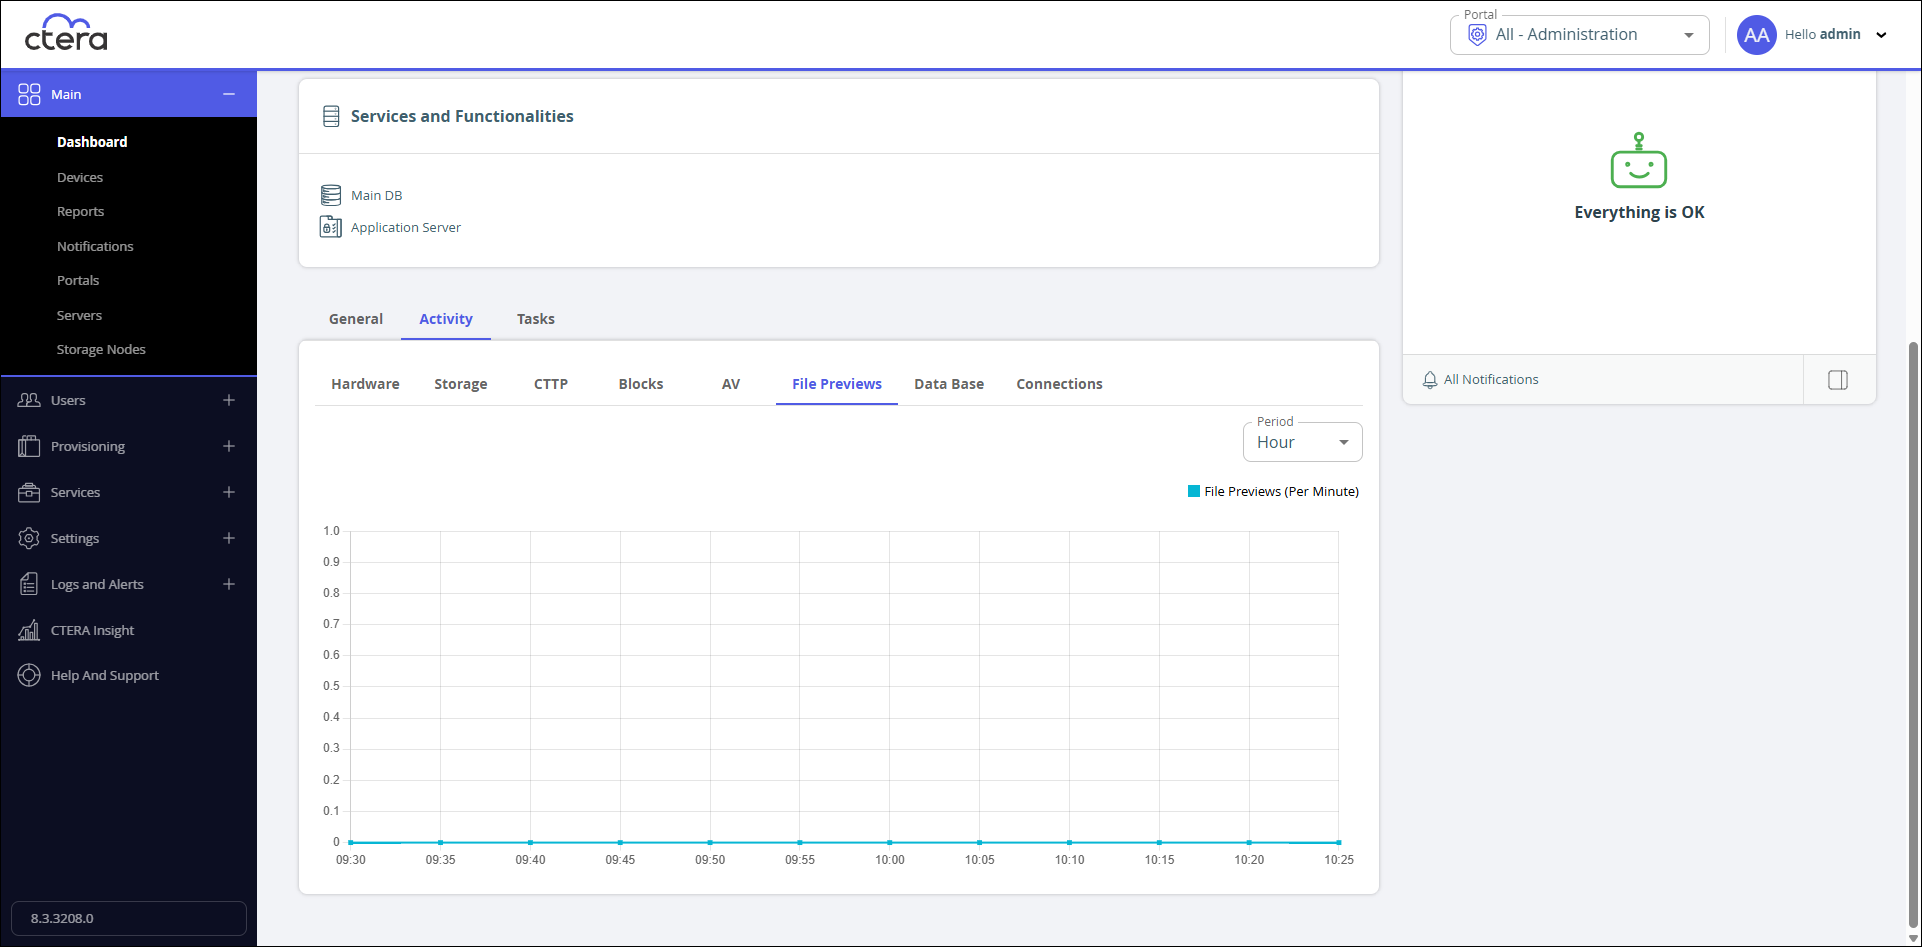
File Previews – The files previewed per minute during the specified time period.
Data Base
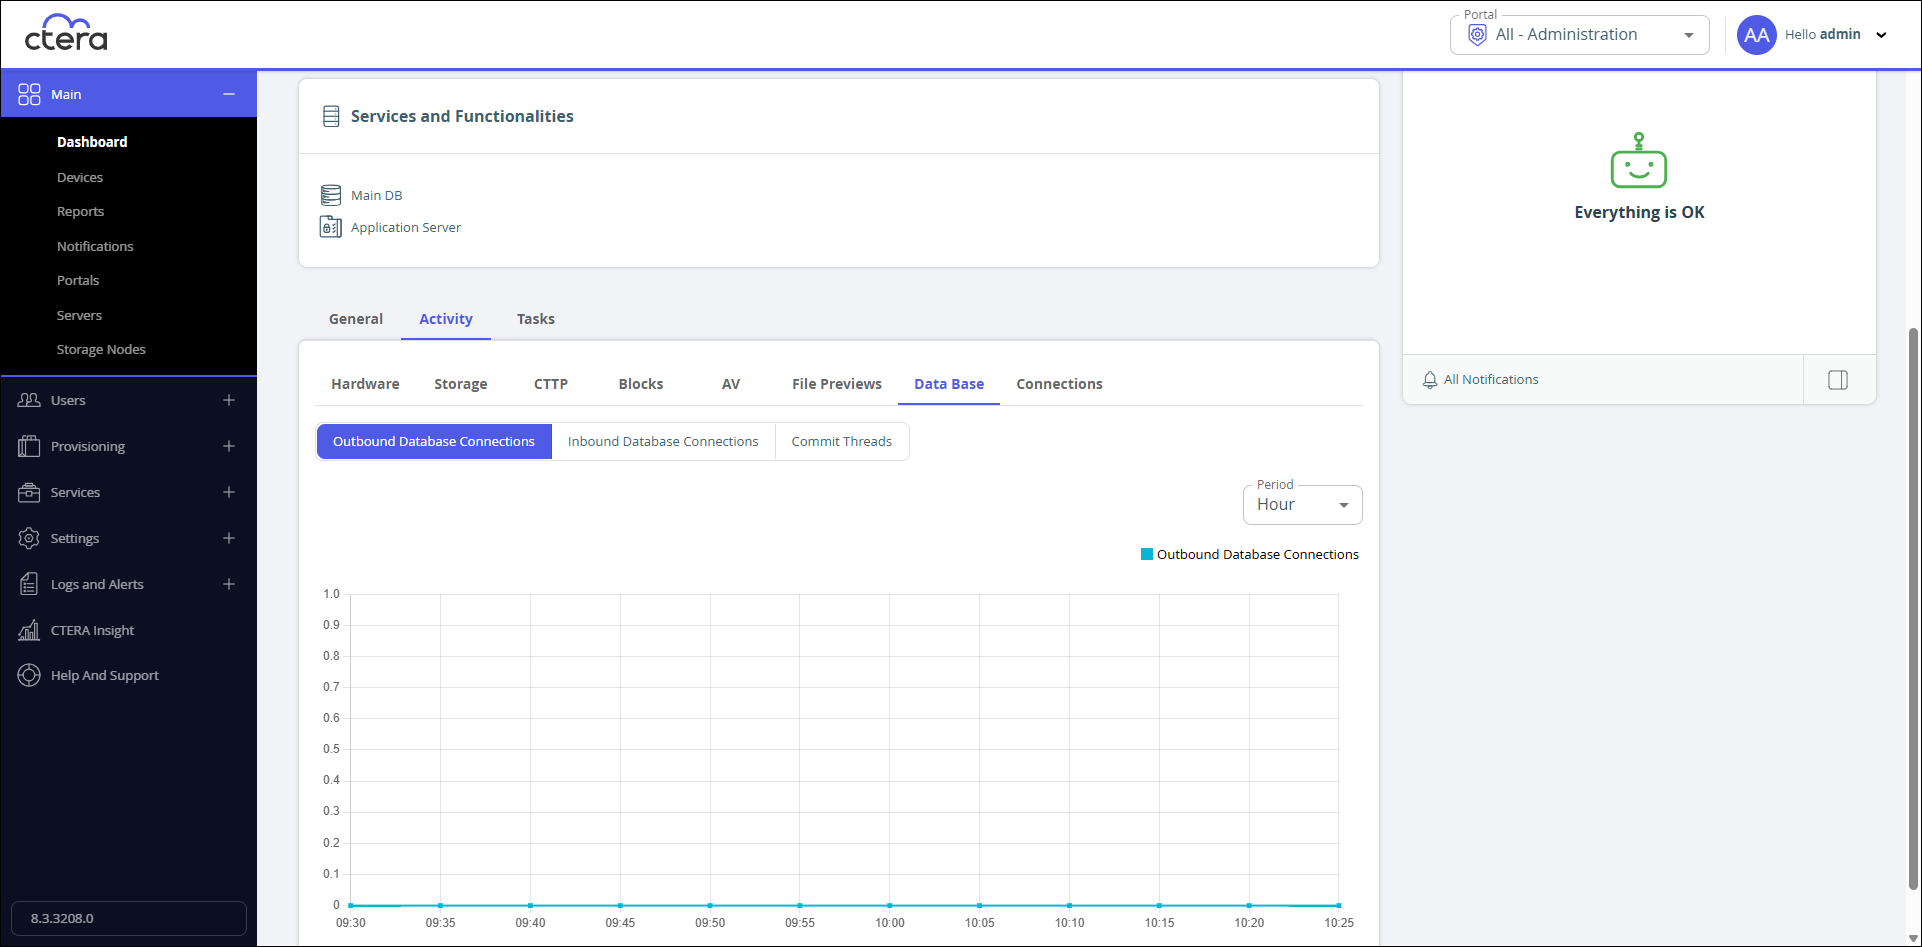
The Database tab is only relevant for the main database and database replication servers.
Outbound Database Connections – The number of outbound database connections over time.
Inbound Database Connections – The number of inbound database connections over time.
- Commit Threads – The number of threads running and waiting.
Connections
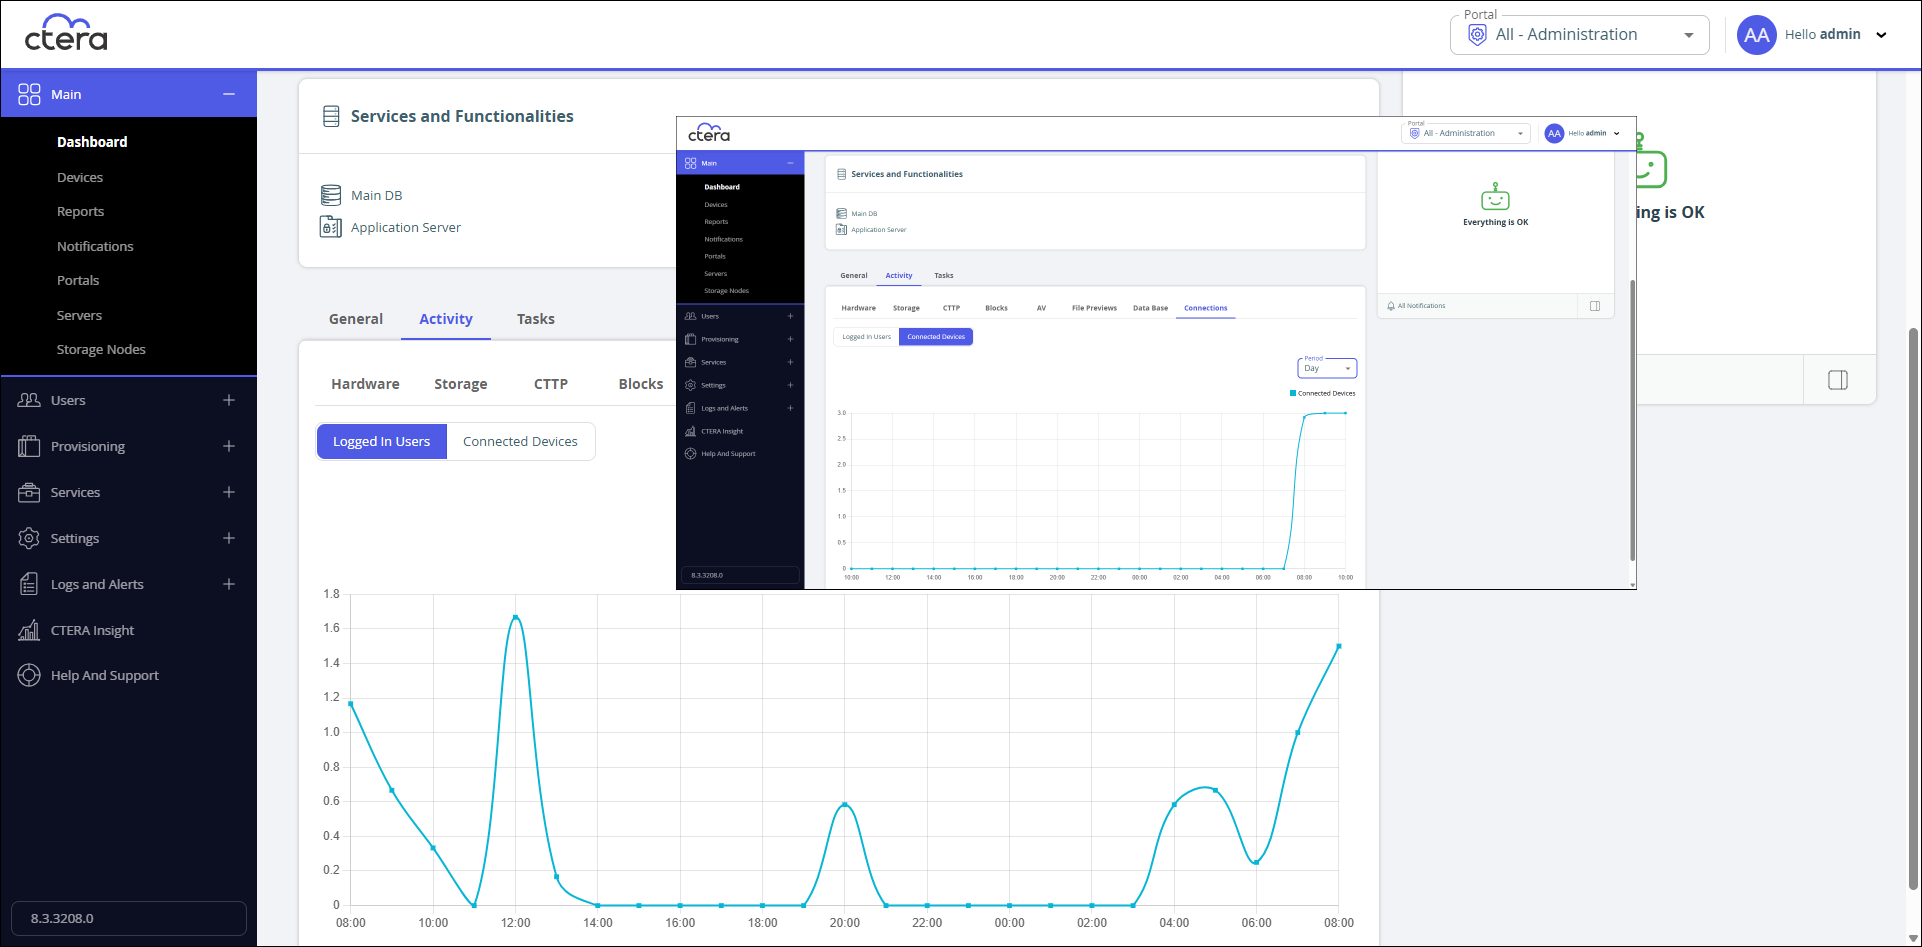
Logged In Users – The number of CTERA Portal administrators logged in over time.
Connected Devices – The number of connected client devices over time.
Tasks
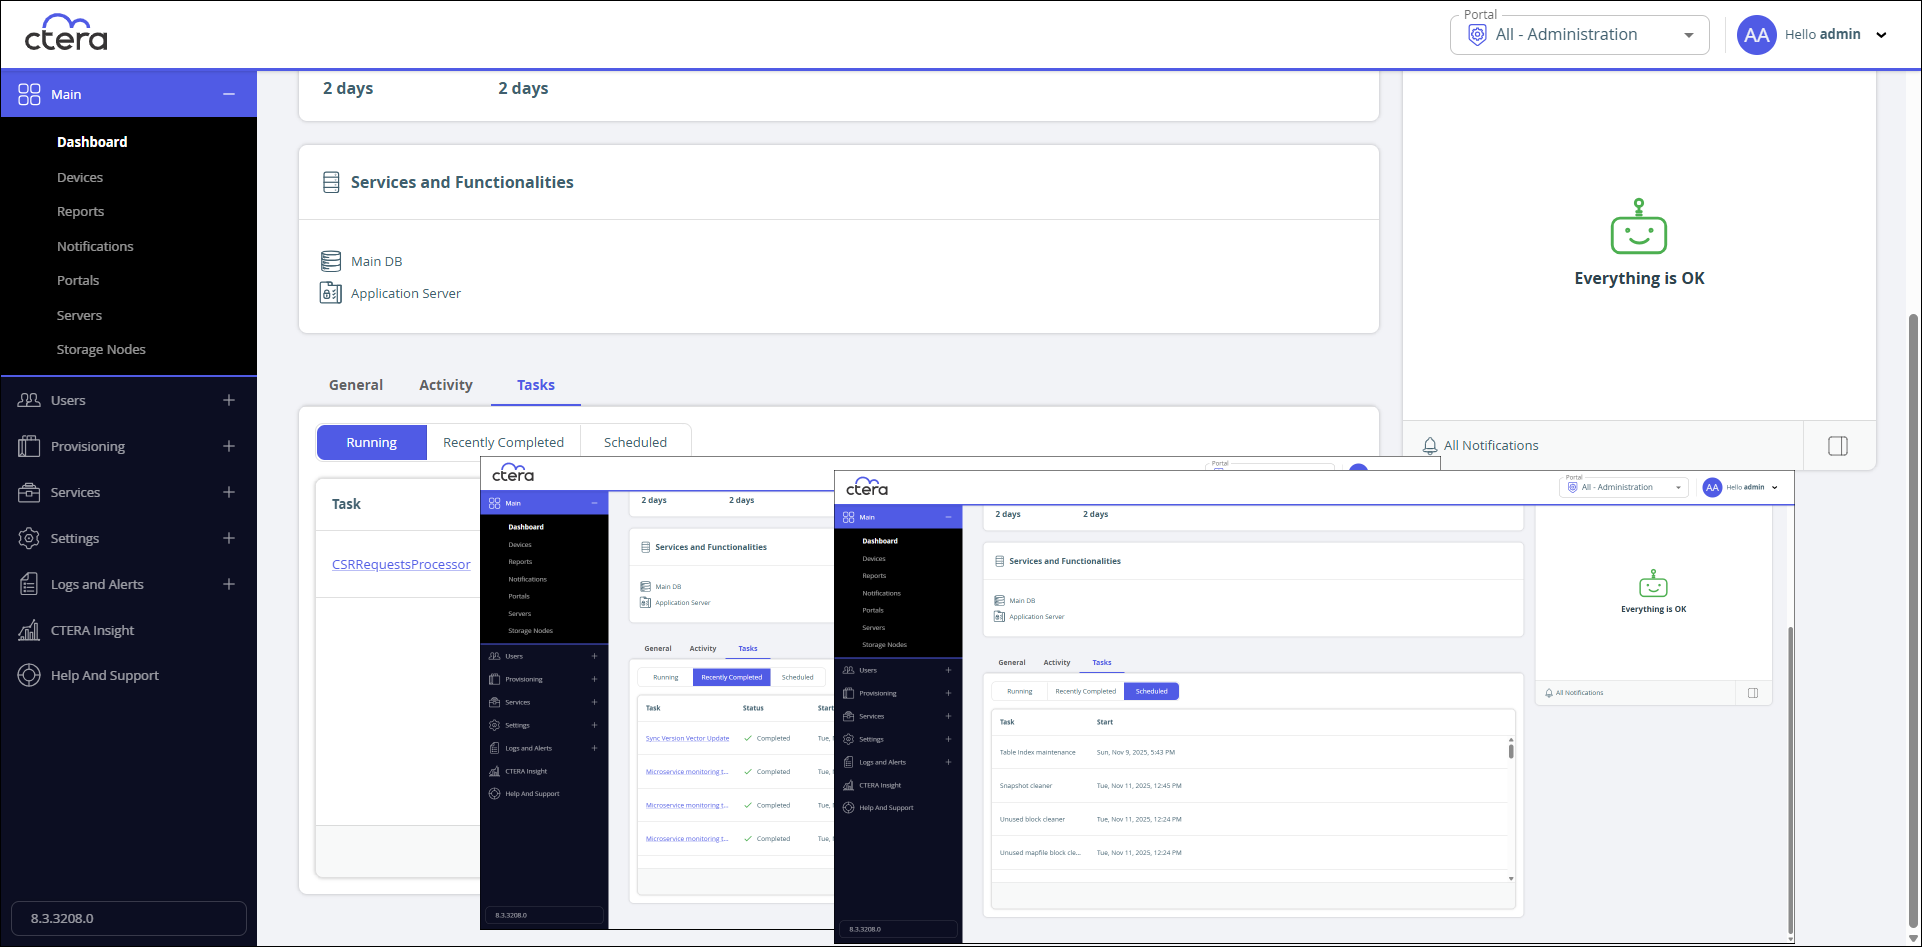
The tasks: Running, Recently Completed, or Scheduled on the selected server.
The following information is displayed for each task.
Task – The name of the task.
Status – The task status, for running and completed tasks.
Start – The date and time at which the task started or will start for a scheduled task.
Duration – The amount of time the task took, or has taken so far for a running or completed task.
Progress – The task's progress for a running task.
Message – Additional information about the task for a running or completed task.
For details about these tasks, see List of the Main Tasks.
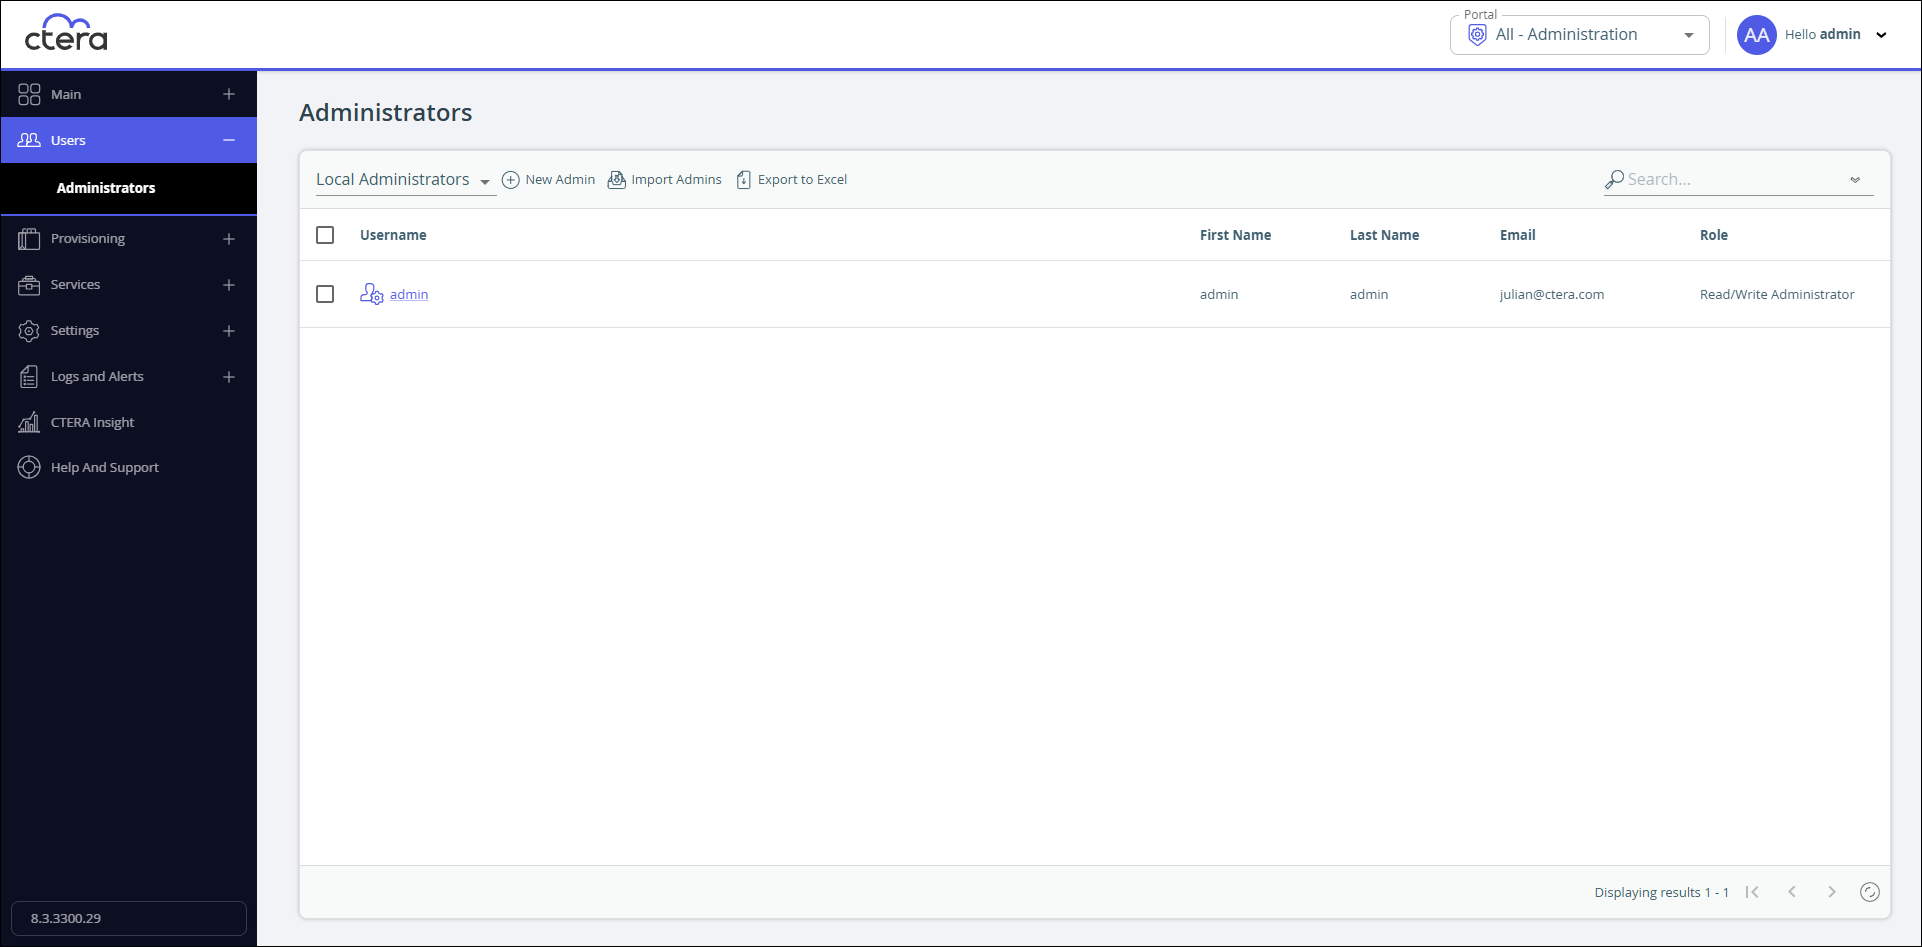
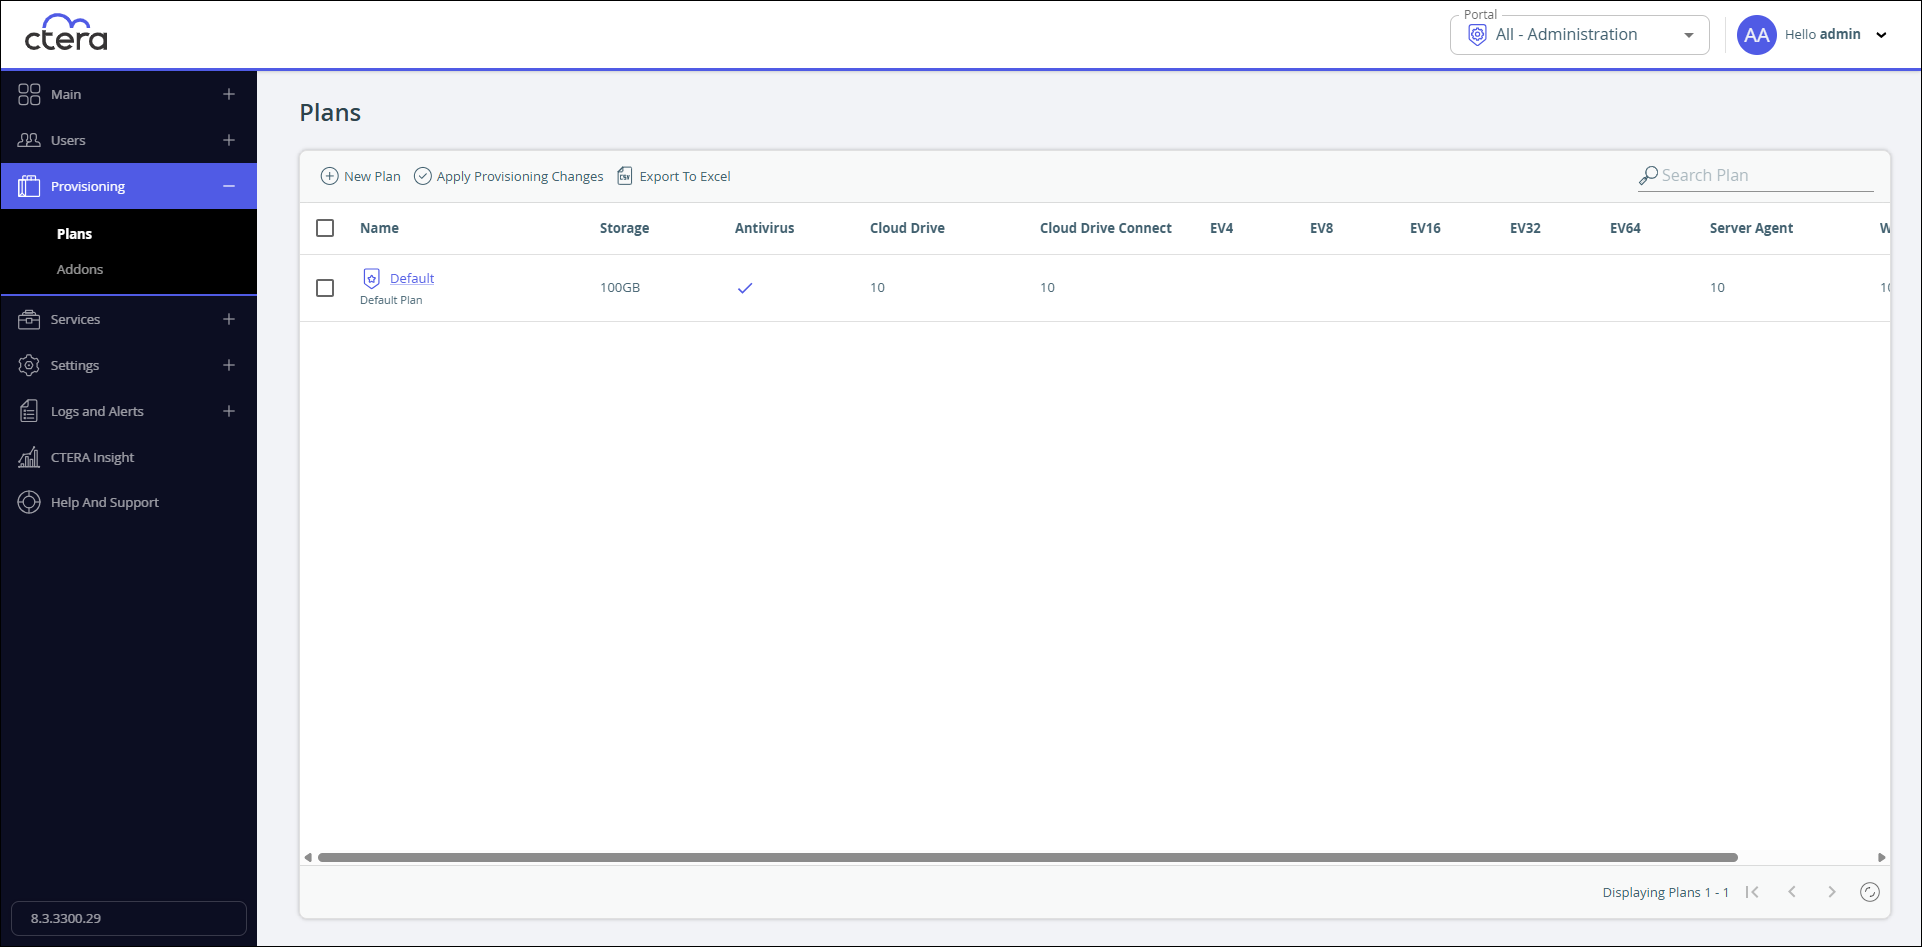
Filtering Searches
Pages with a search option can include a filter option.
For example, the Administrators page can be filtered using the username, first name, lastname, or email address. The Plans page search option does not include a filter capability.
| Filter Option | No Filter Option |
|---|---|
 |
 |
Navigating Between Portal Views
To navigate between the administration view and a specific virtual portal view:
- In the view drop-down in the top bar select All - Administration or the virtual portal you want to manage. You can start typing the name of the portal in the drop-down to filter the names displayed in the drop-down.
Note
If there are too many portals to list in the drop-down, you can also choose Main > Portals in the navigation pane of the administration view and scroll to the portal you want.
For information about administering each team portal, see the Team Administrator Guide.