To display device statistics:
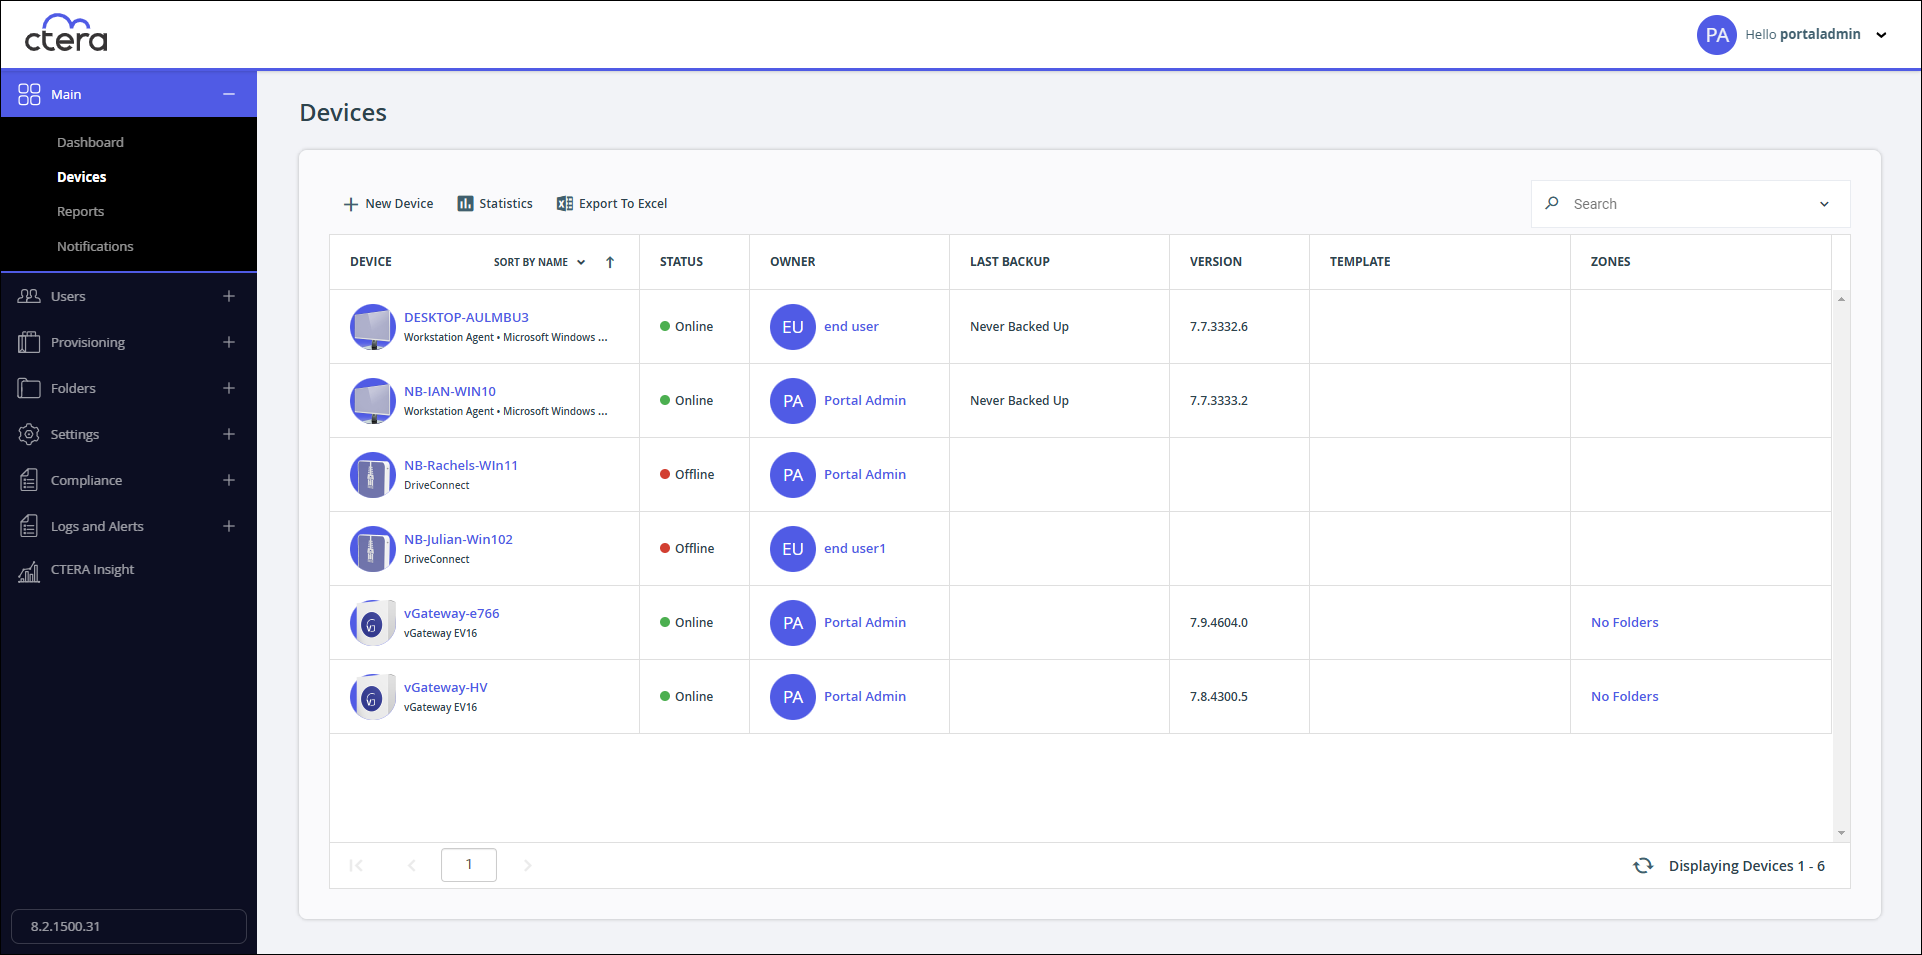
- Select Main > Devices in the navigation pane.
The Devices page opens, displaying all the devices registered to the portals.

- Either:
Click in the Devices page.
Or:- Click the device name.
The device details are displayed in a new browser window. - Click the Cloud Drive tab.
The cloud drive details for the device are displayed. - Click
 .
.
- Click the device name.
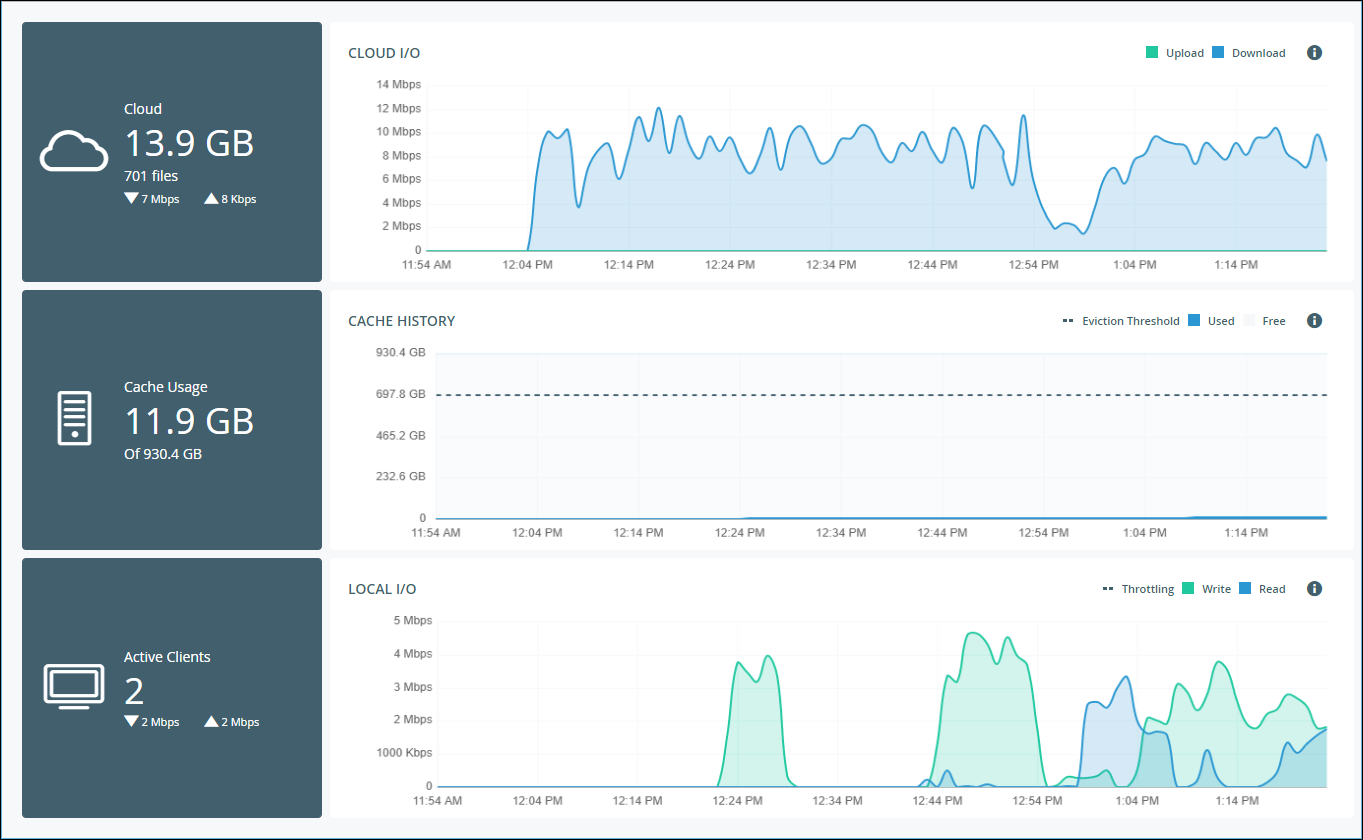
The statistics window is displayed in a new browser window.

The graphs show the following:
Cloud I/O – Rate of transfer of data over time from the CTERA Edge Filer to the CTERA Portal (Upload) and the CTERA Portal to the CTERA Edge Filer (Download).
Cache History – The amount of data in the cache over time.
Local I/O – The write rate from the client to the CTERA Edge Filer and the read rate from the CTERA Edge Filer to the client, over time.
You can view the cloud drive by clicking  .
.
You can view a log of all file activity on the cloud drive by clicking  .
.