The portal interface consists of the following elements:
Top bar – The list of portals in a drop-down menu and the user name at the top right. Clicking the avatar or administrator initials next to the name displays additional options, such as access to online help.

Navigation Pane – To navigate between pages to manage the portal and the portal version.
Content area – Displays the page content.
The Main Dashboard
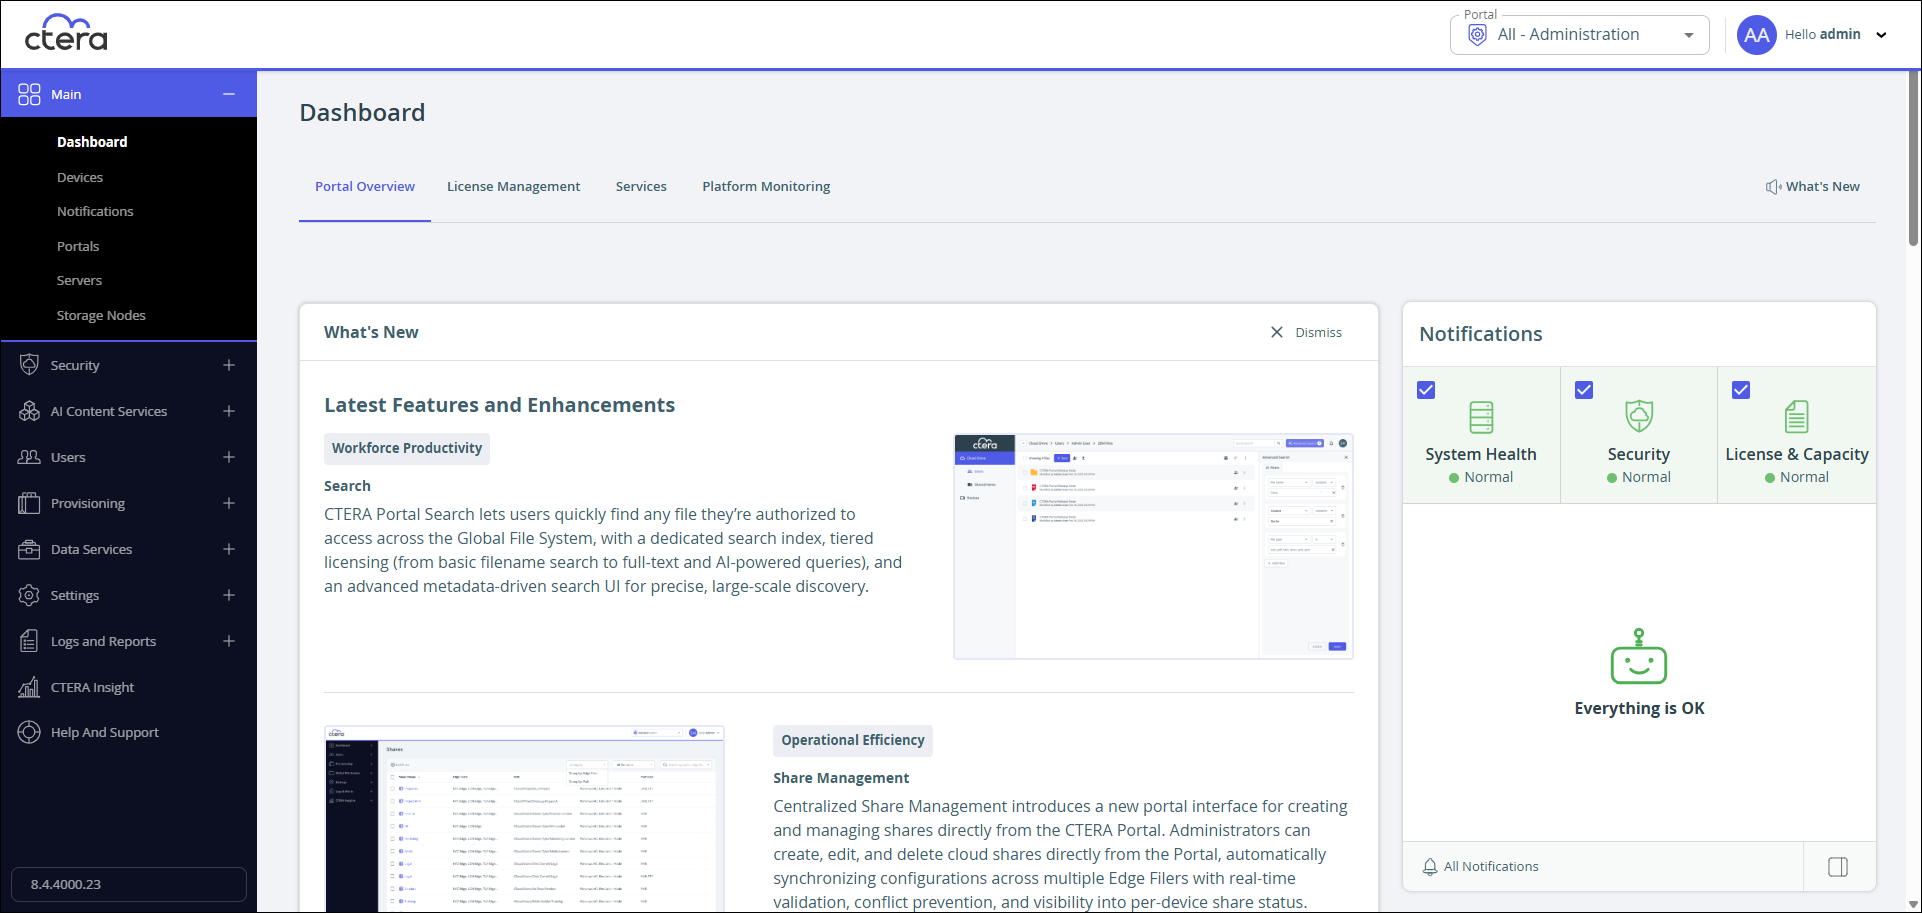
The dashboard includes Portal Overview, License Management, Services, and Platform Monitoring tabs and a Notifications section.
Viewing Notifications in the Main Dashboard
The dashboard displays a summary of active notifications.

For details of all notifications in the Notifications page, click on All Notifications. For more details about notifications, see Managing Notifications and Email Templates.
Portal Overview
The Portal Overview tab displays an overview of the CTERA Portal.
What's New
The dashboard initially displays what's new in this portal release.

To hide the What's New section, select Dismiss.
You can redisplay the What's New content by clicking What's New.
Users and Devices
The Users and Devices panel displays the total number of users and devices registered to all the team portals and the overall status of the devices. It also shows how many edge filers are offline.
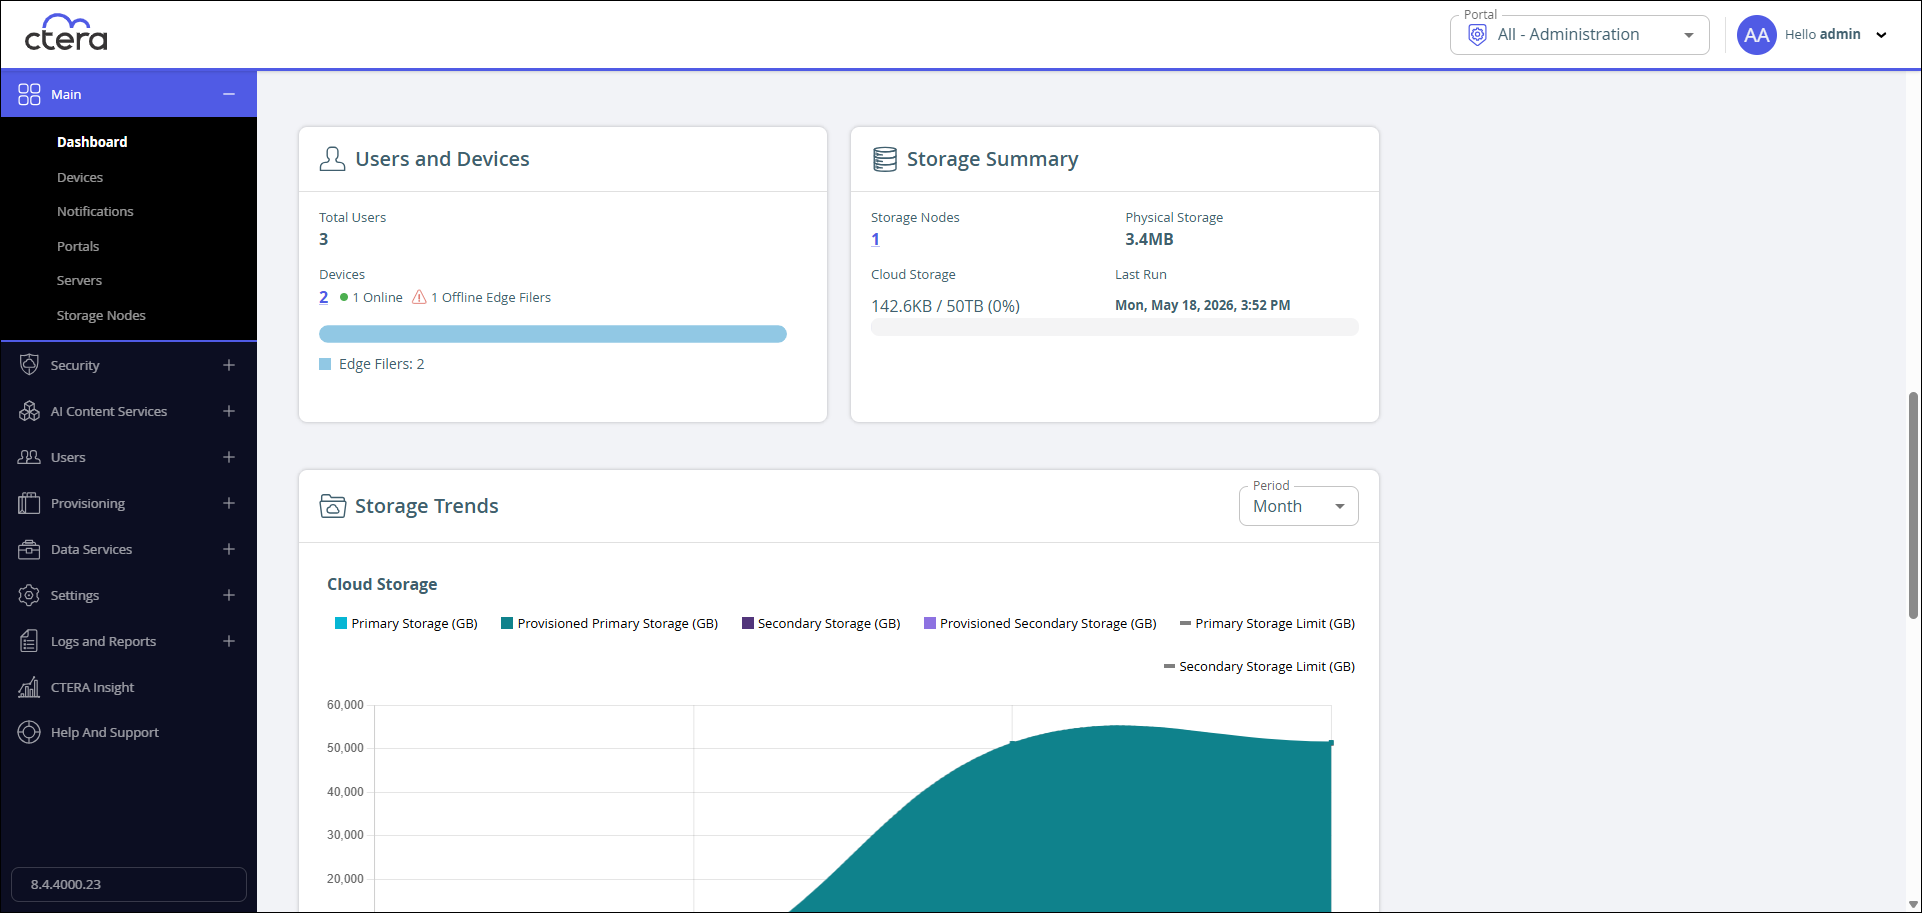
Storage Summary
The Storage Summary panel displays storage nodes for the portal, the physical storage used, the cloud storage used, and the last time that the storage summary was generated. The summary is updated with the information from the storage reports.

Storage Trends
Storage trends over time for the different cloud storage types: primary, provisioned primary, secondary, and provisioned secondary. In addition, the primary and secondary storage limits are displayed.
In the Period drop down, select the time period to display: week, month, or year.
To filter the graph click a type to either hide it or display it.

Users
A summary of the number of users and new users over time.
In the Period drop down, select the time period to display: week, month, or year.
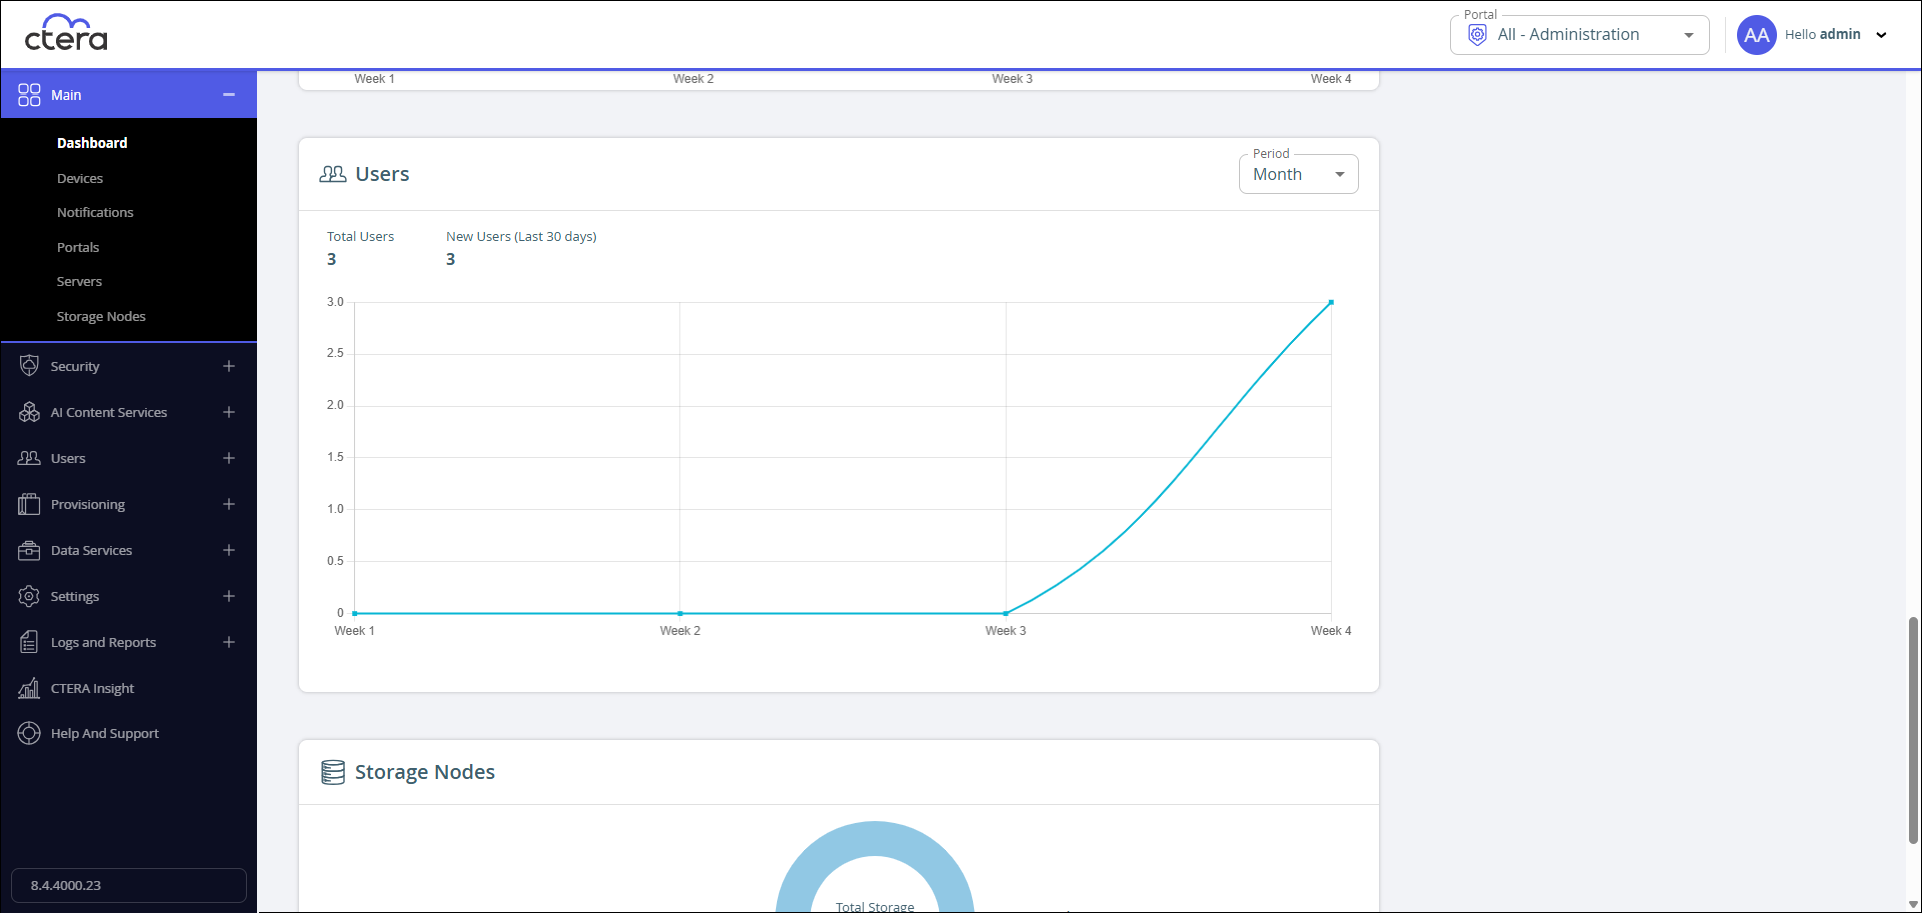
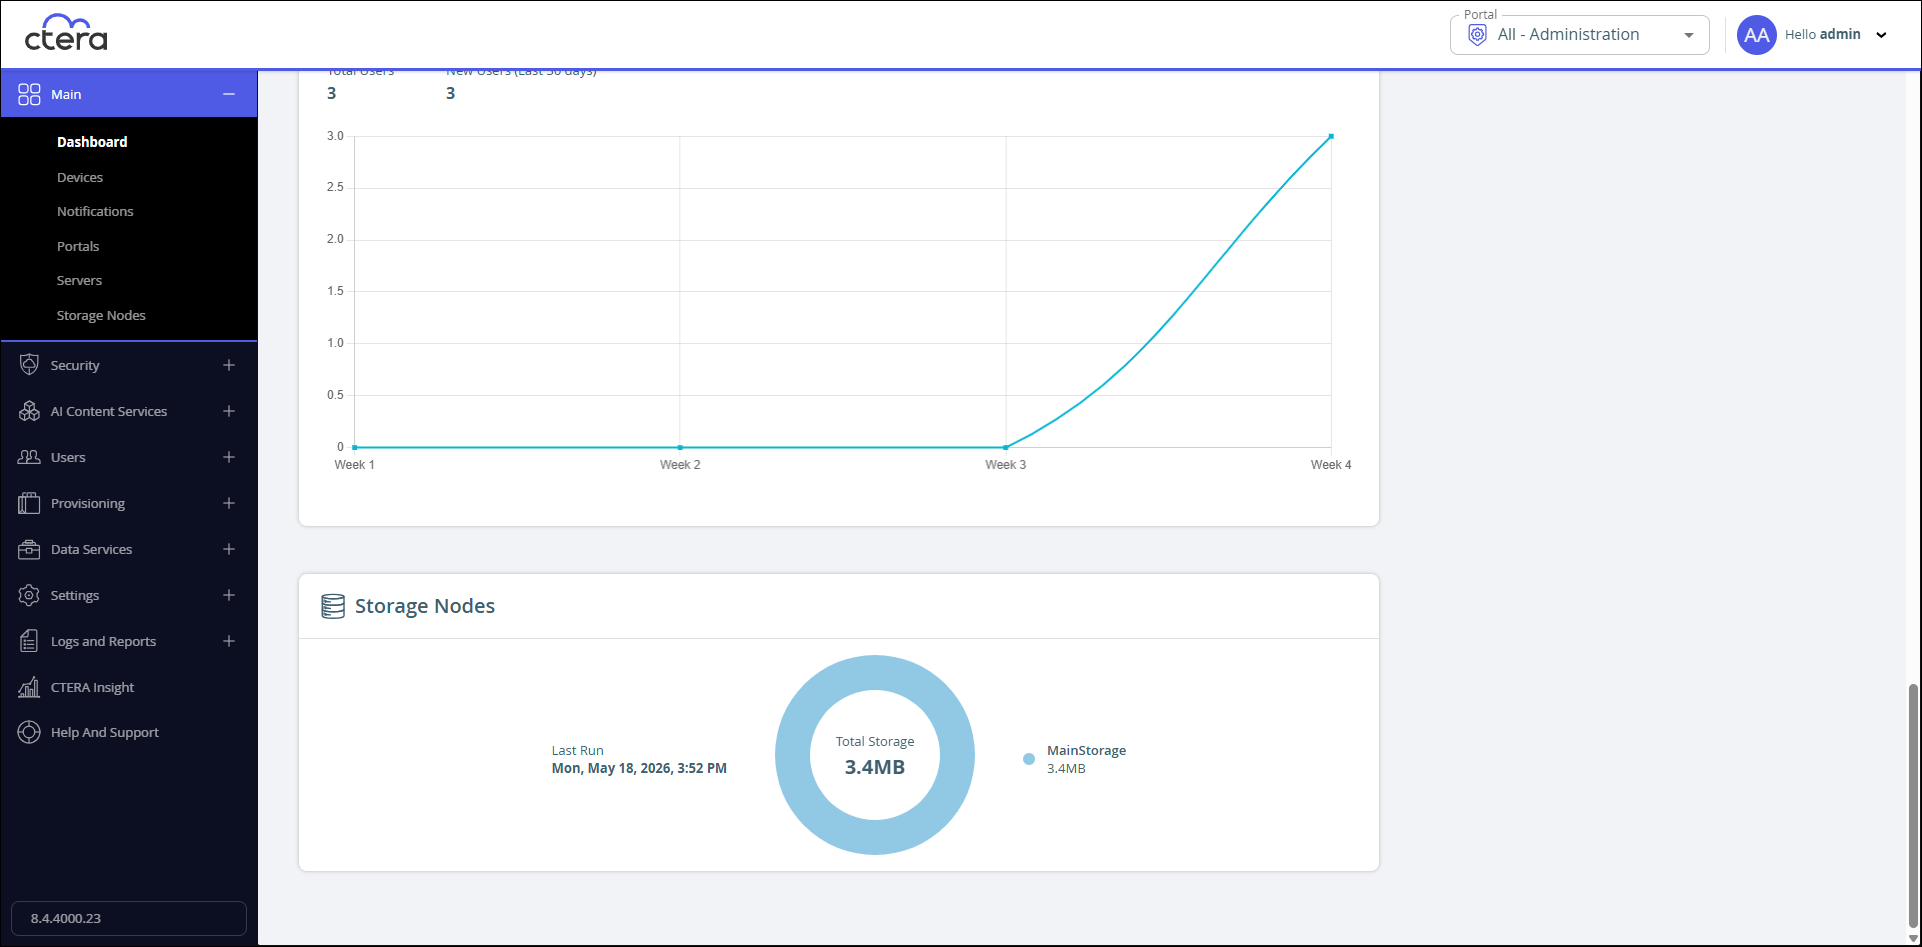
Storage Nodes
The total storage used and the last time that the storage summary was generated.
License Management
The License Management tab displays an overview of licenses with the usage for that license and the license trends.
Licenses Overview
A summary of what is licensed and the license quotas and current use in GB and the percentage used.
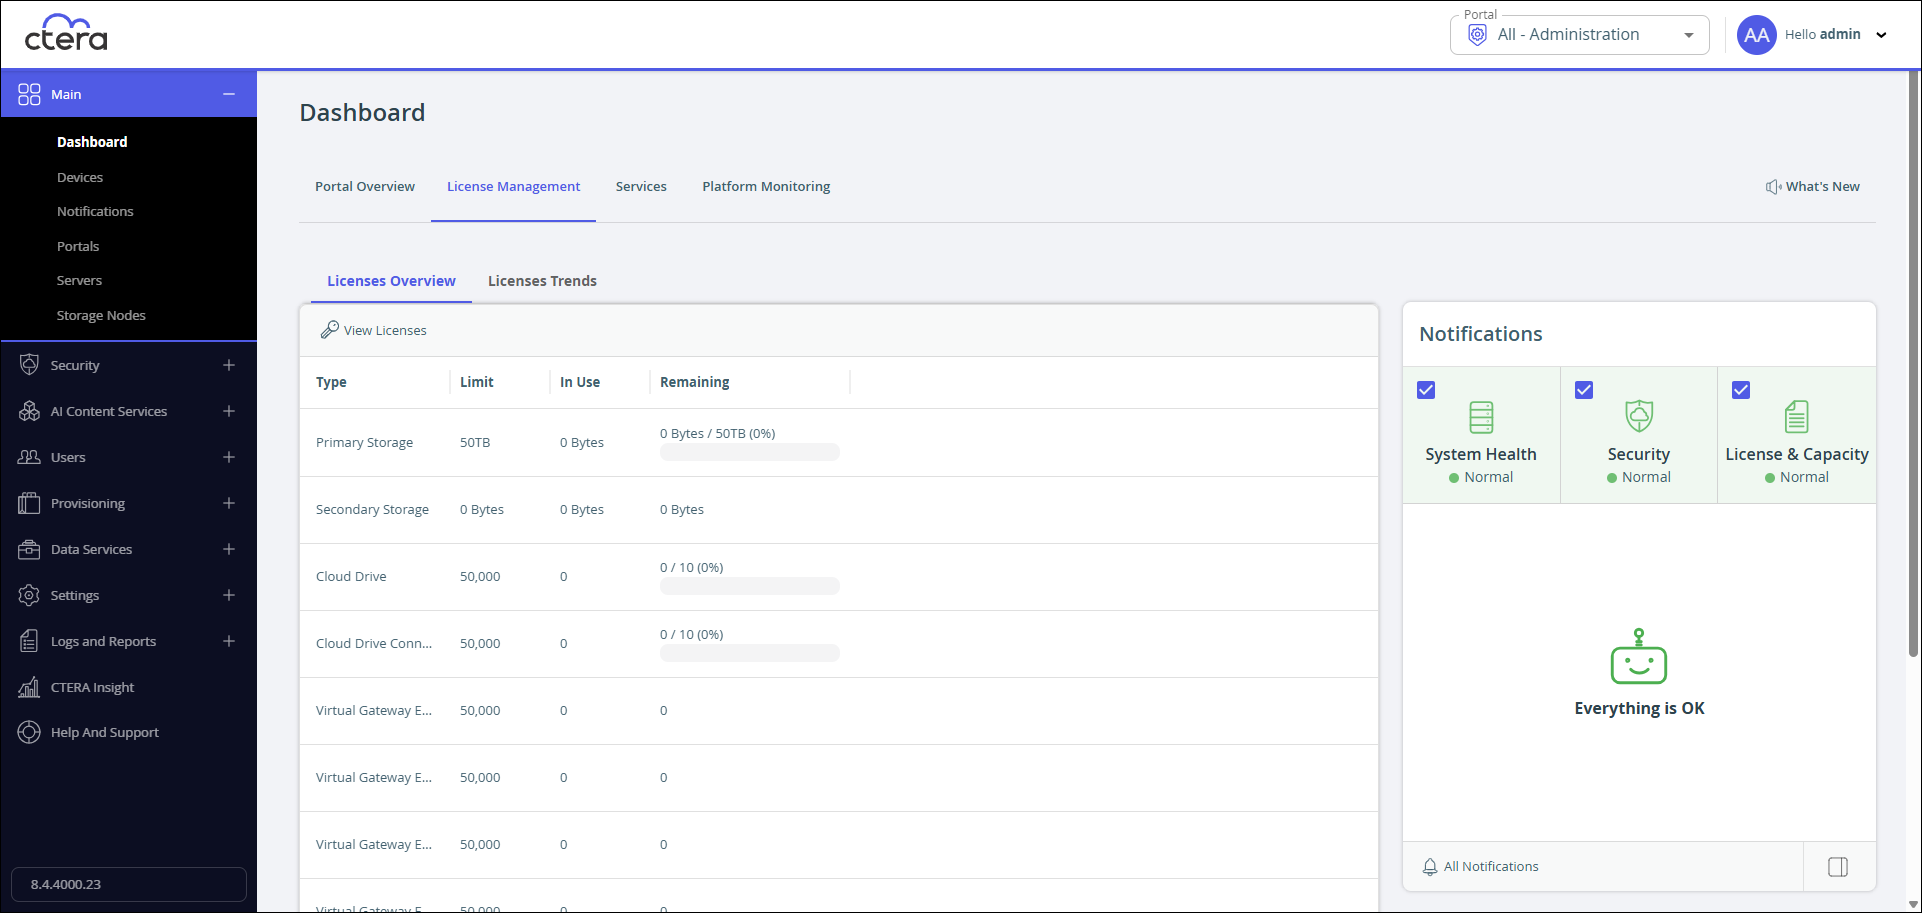
Click View Licenses to display the License page.
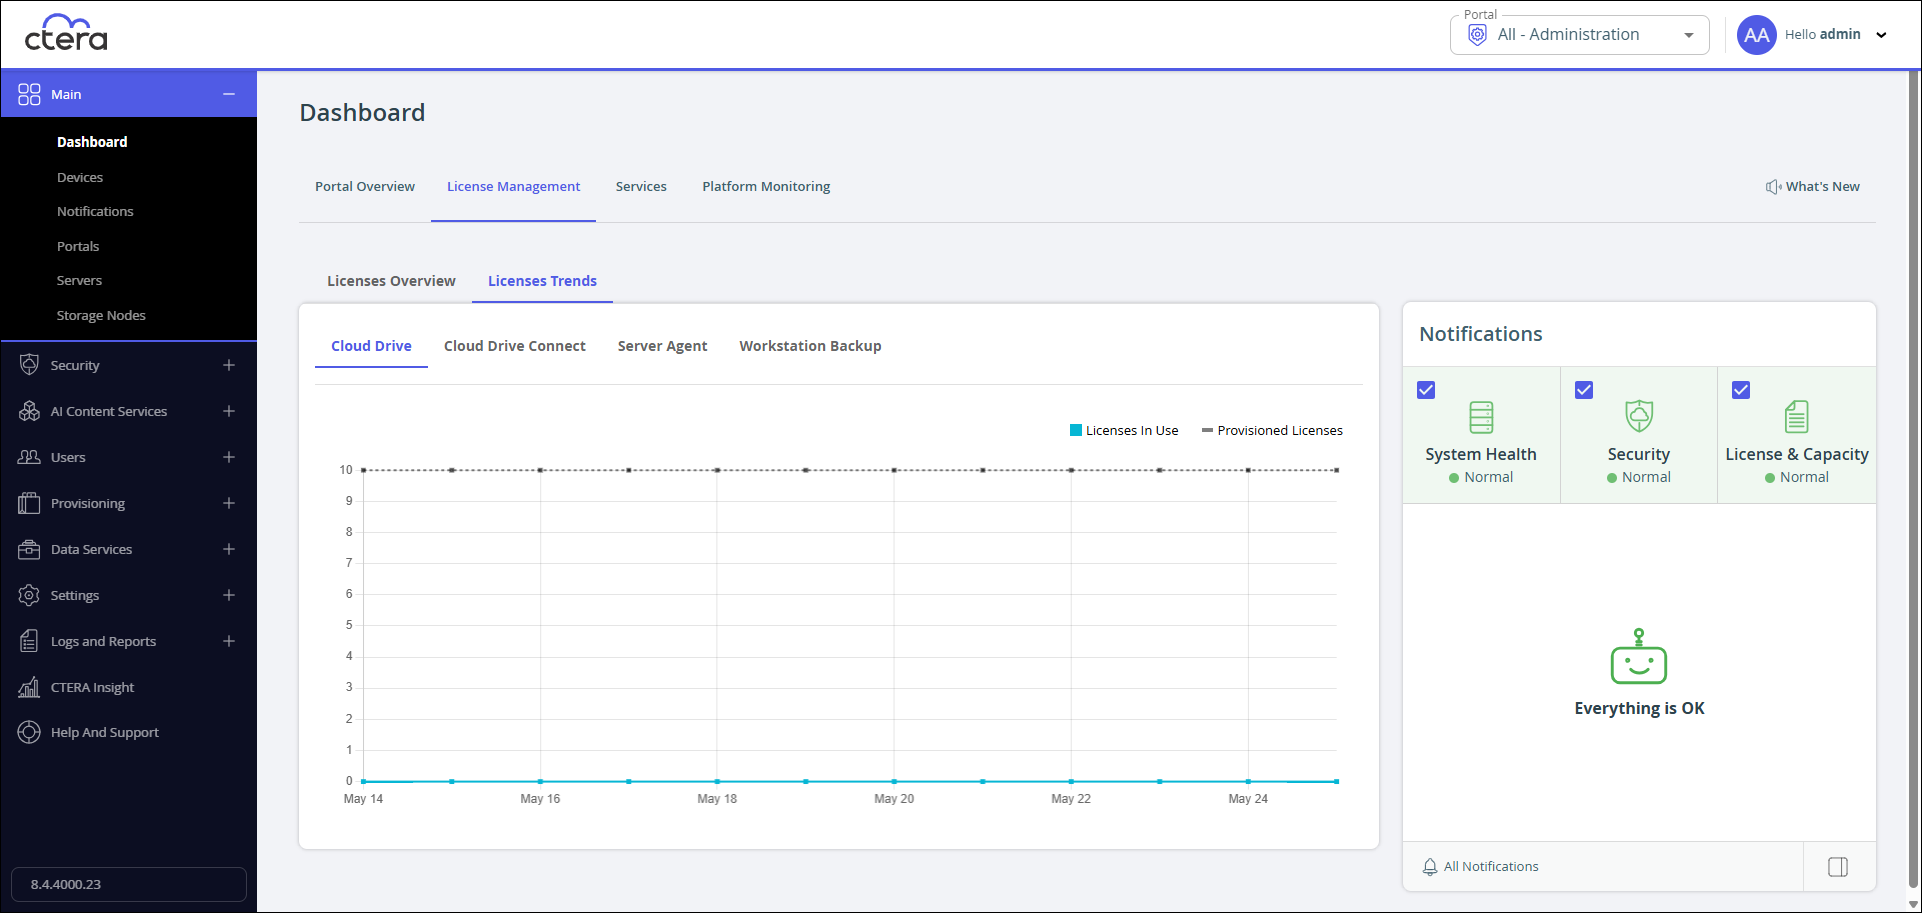
Licenses Trends
License usage showing both the provisioned licenses and actual licenses in use. Click the type of license to see the trend for that license type.
To filter the graph click License In Use or Provisioned Licenses to either hide or display the specific trend.
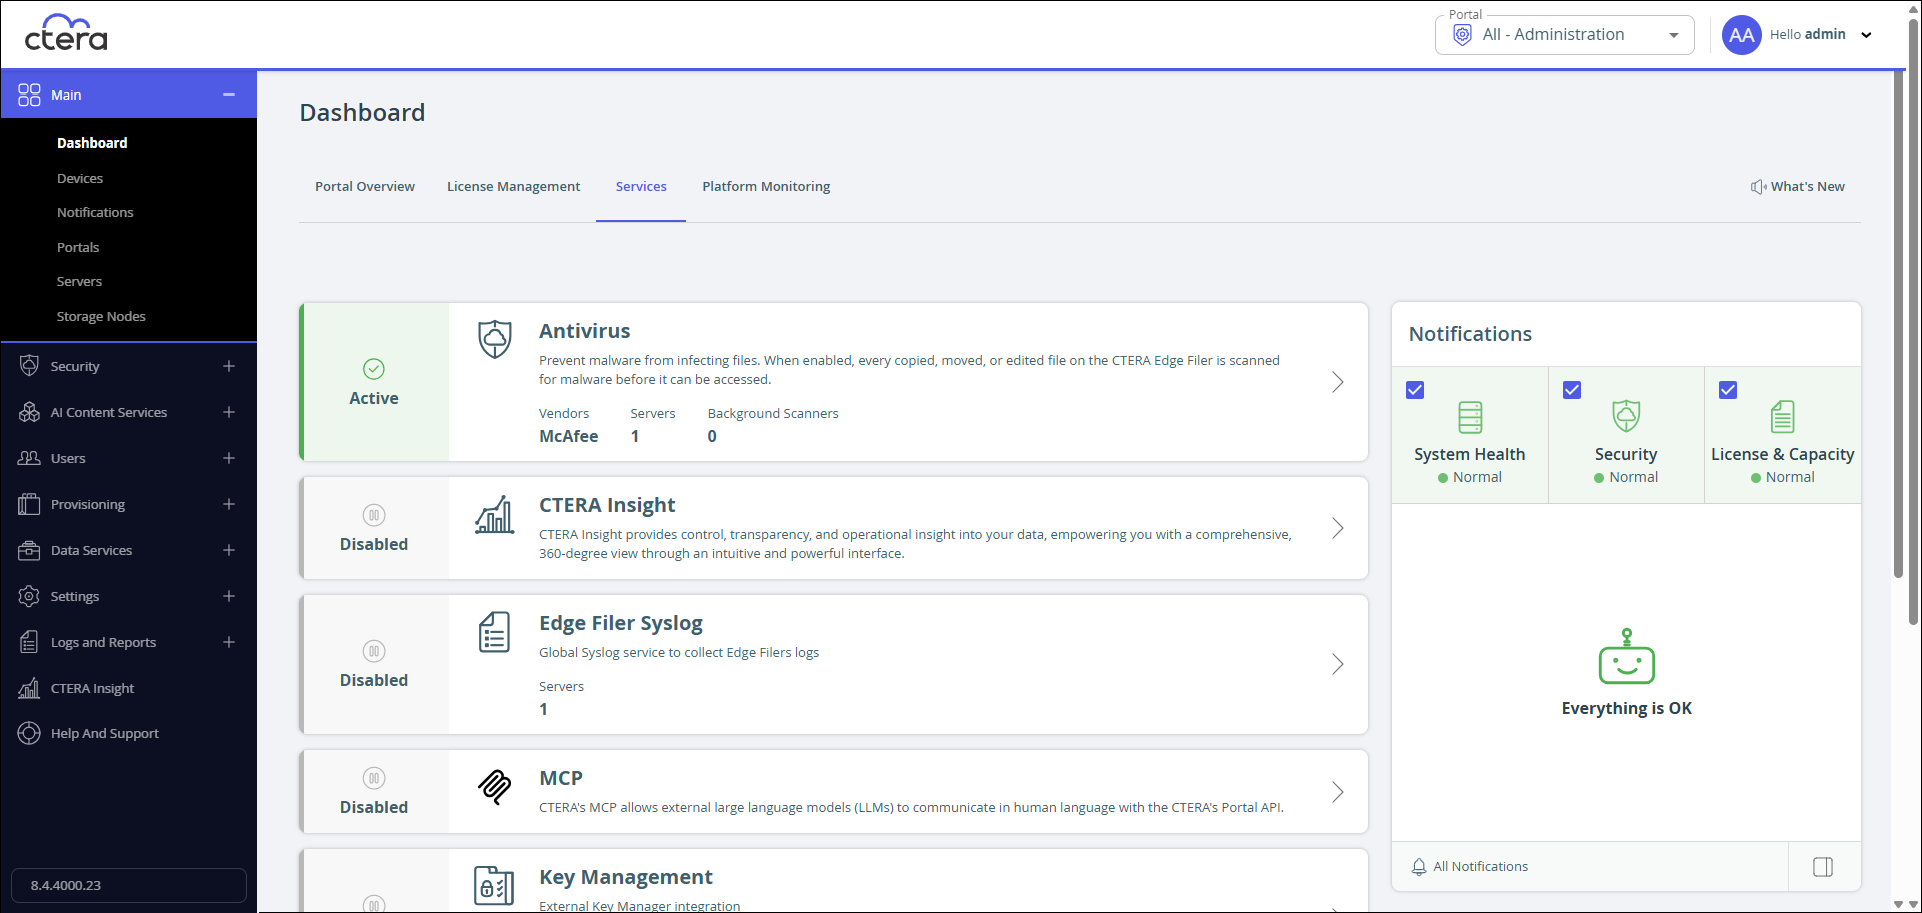
Services
The status and activity of the data services. Clicking > to the right of a service displays the service page. For example, clicking > for the Antivirus service displays the Antivirus page.
Platform Monitoring
Platform monitoring is per server. For details, see Monitoring a Server.
Filtering Searches
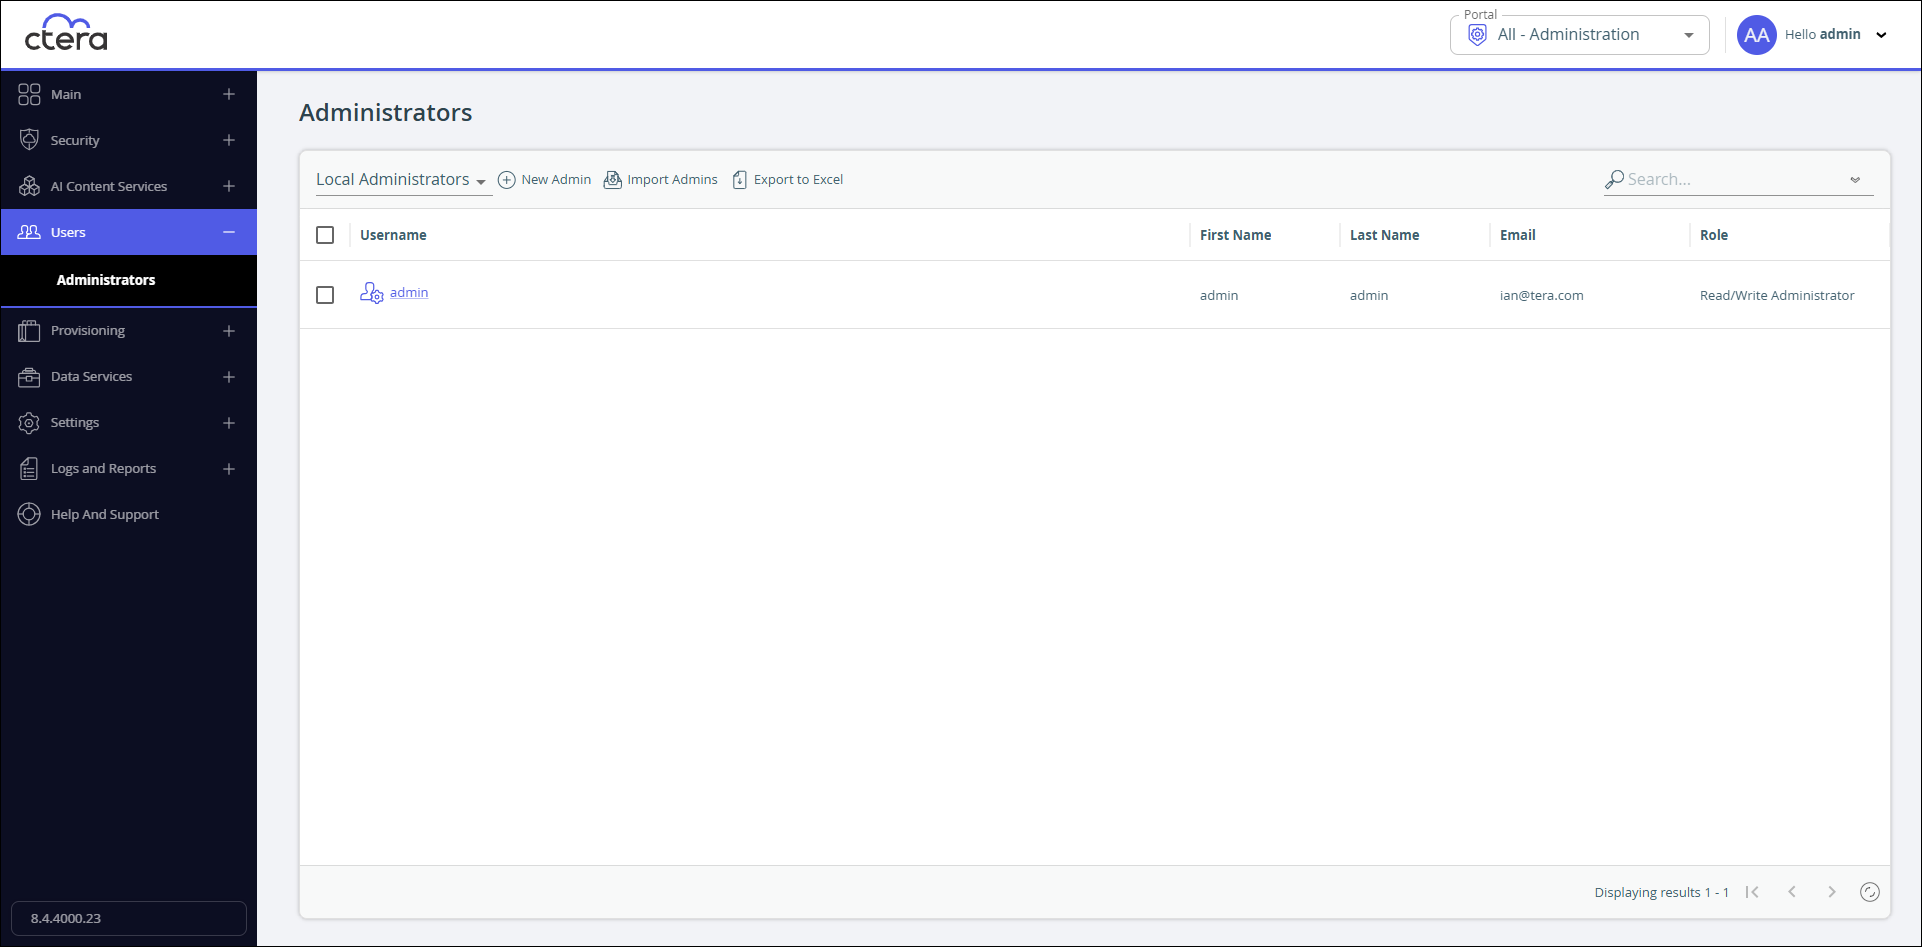
Pages with a search option can include a filter option.
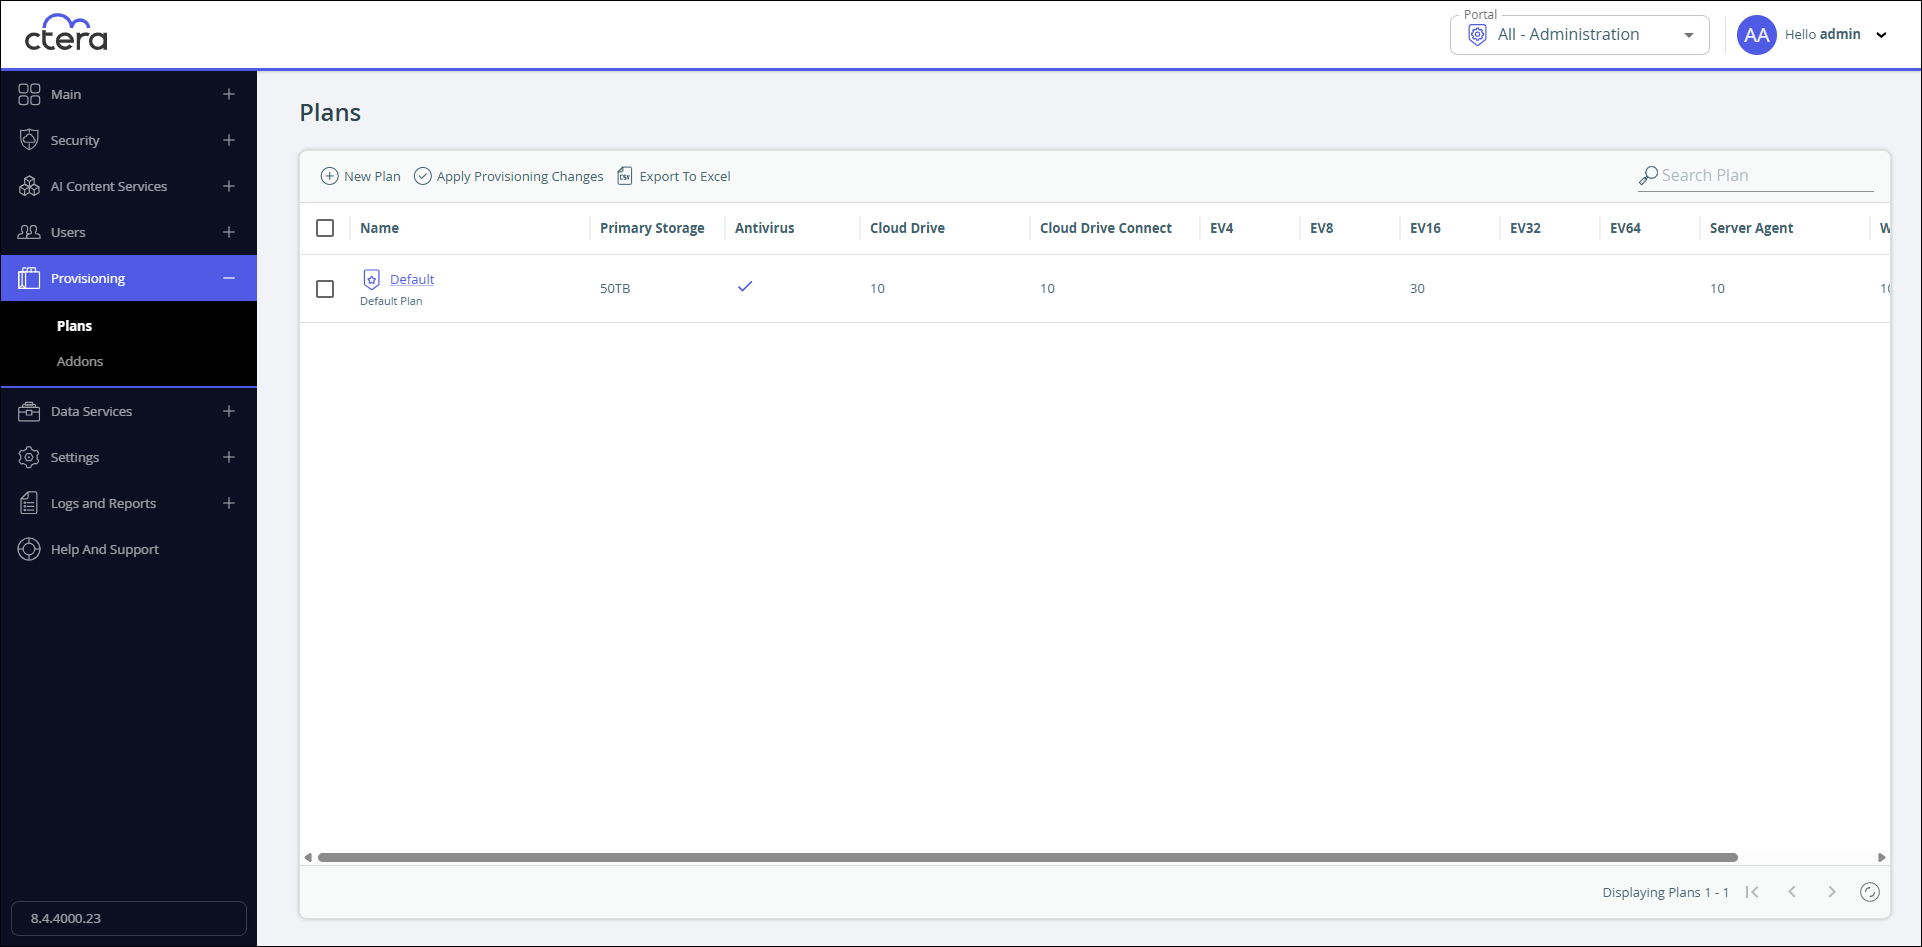
For example, the Administrators page can be filtered using the username, first name, lastname, or email address. The Plans page search option does not include a filter capability.
| Filter Option | No Filter Option |
|---|---|
 |
 |
Navigating Between Portal Views
To navigate between the administration view and a specific virtual portal view:
- In the view drop-down in the top bar select All - Administration or the virtual portal you want to manage. You can start typing the name of the portal in the drop-down to filter the names displayed in the drop-down.
Note
If there are too many portals to list in the drop-down, you can also choose Main > Portals in the navigation pane of the administration view and scroll to the portal you want.
For information about administering each team portal, see the Team Administrator Guide.