You can monitor the platform by server:
- From the Servers page, click the server to monitor and then click More Details.
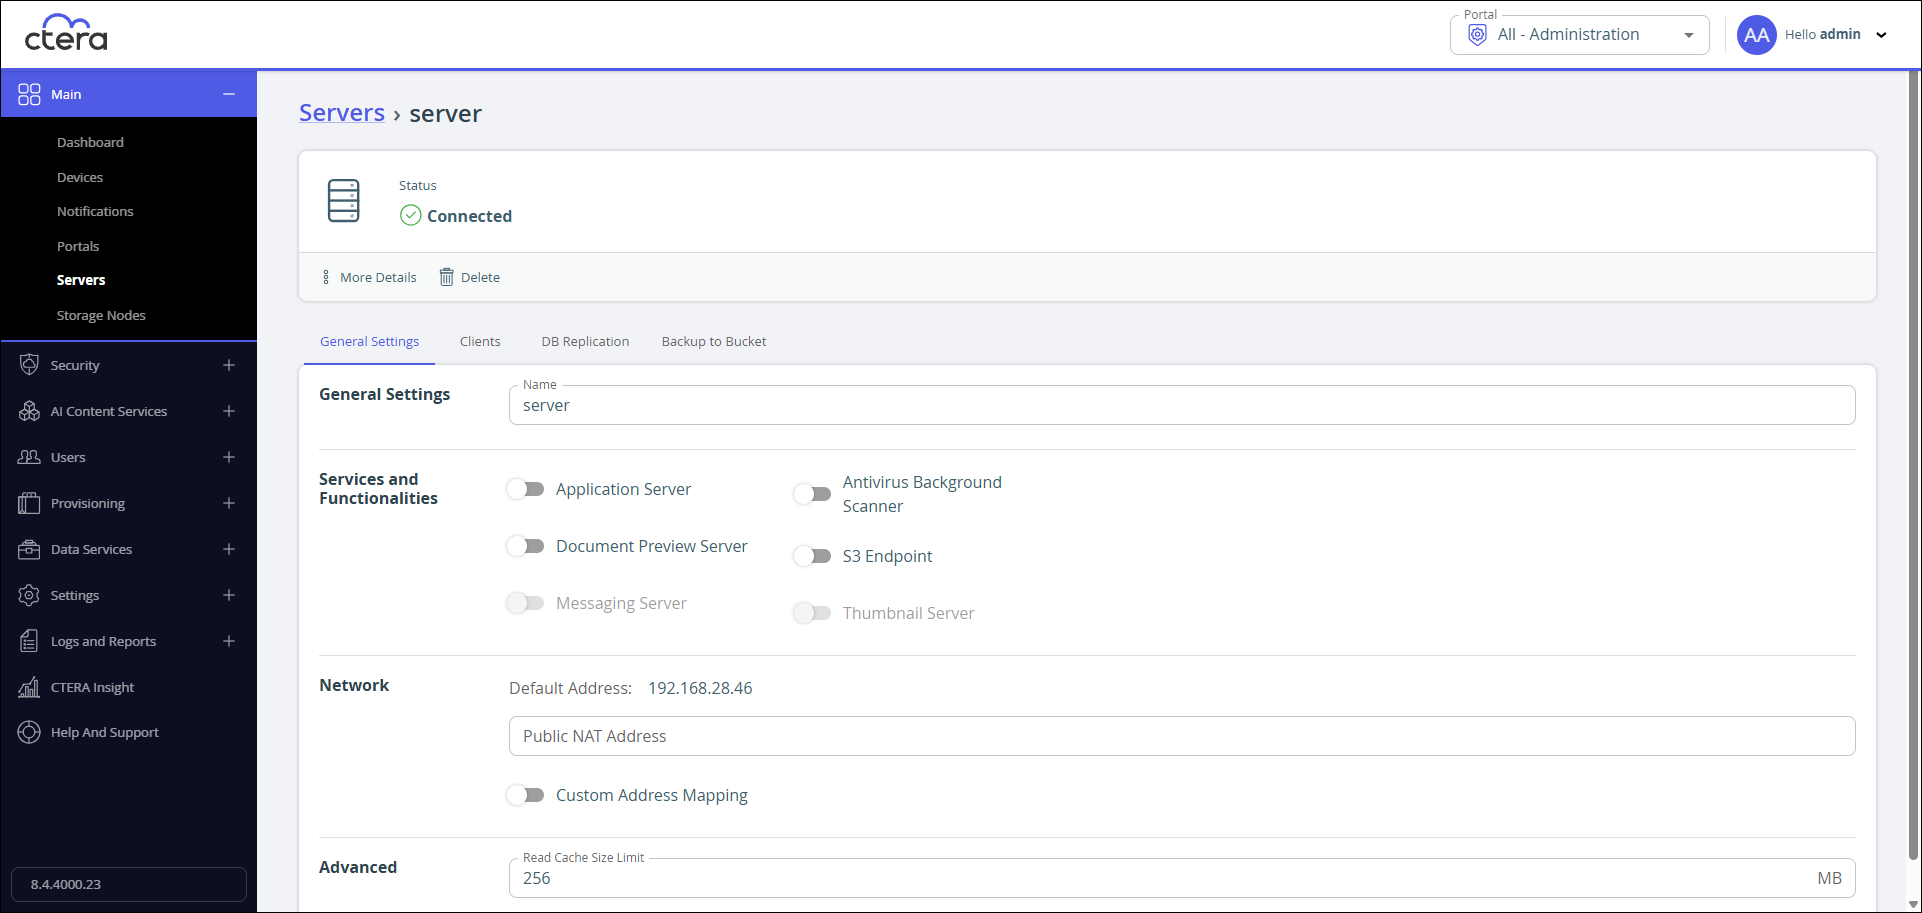
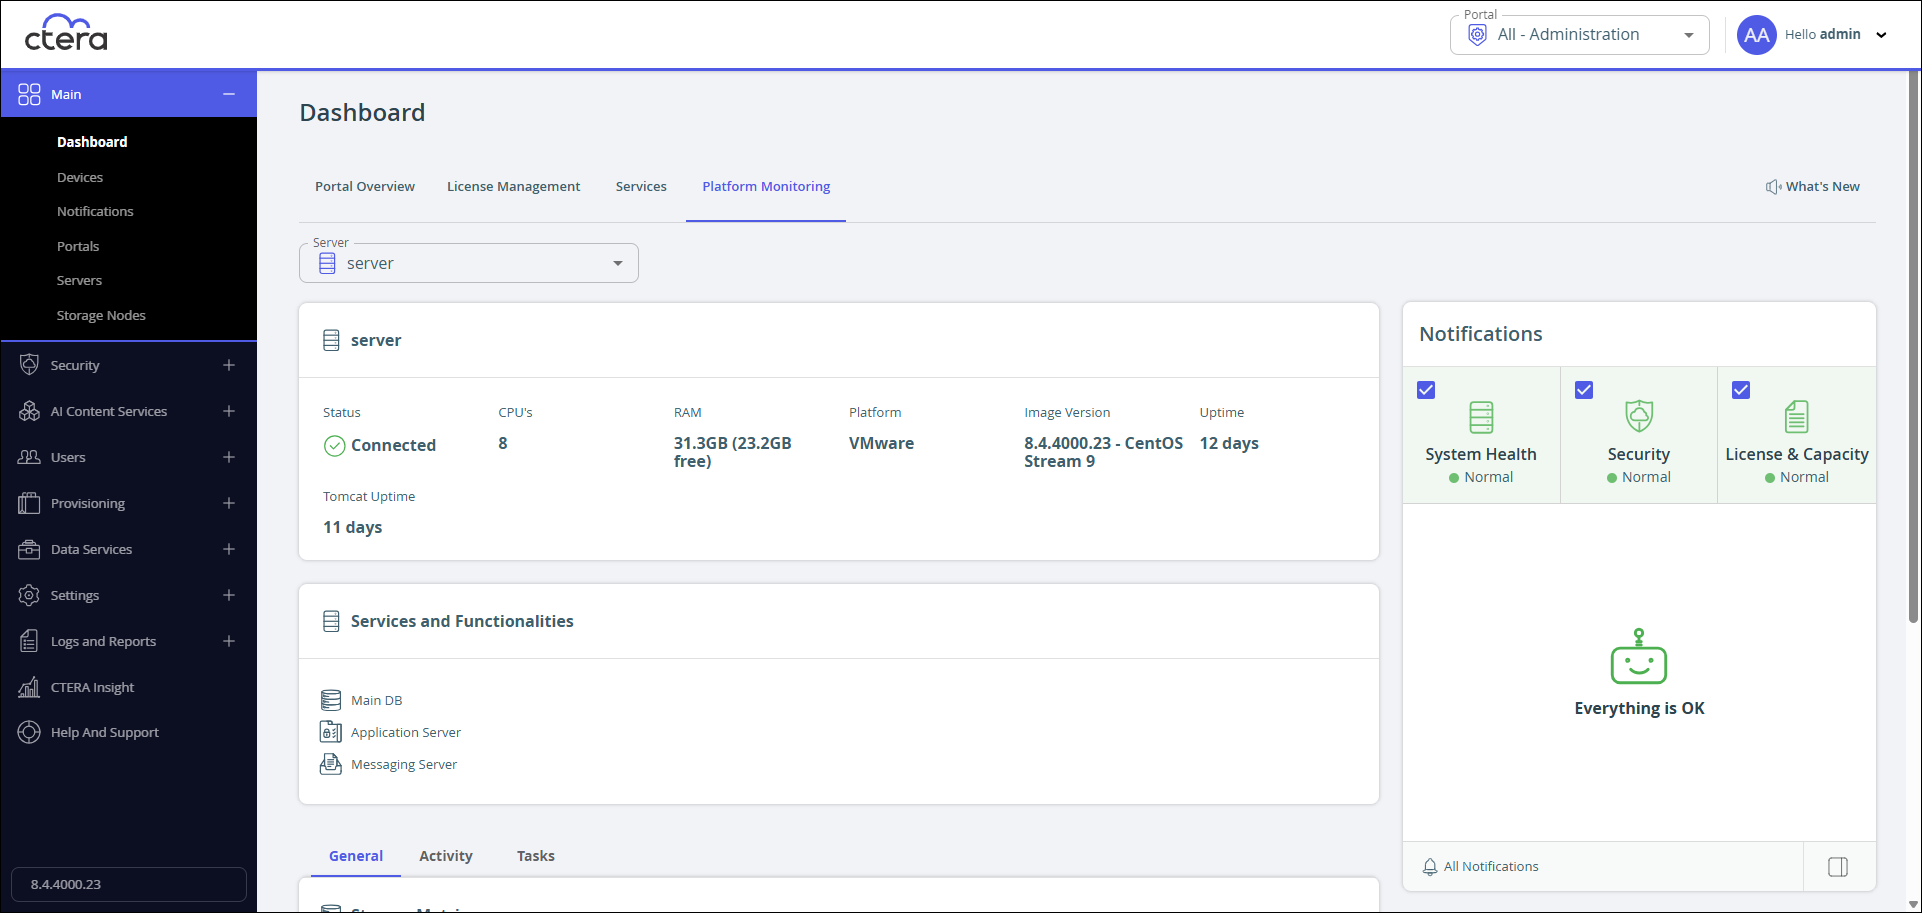
The Platform Monitoring tab in the Dashboard page is displayed for the server. - From the Platform Monitoring tab in the Dashboard page, select the server to monitor from the Server drop-down
The server monitoring includes the following:
- Server details.
- Services and functionalities for that server.
- General monitoring and activity and tasks monitoring.
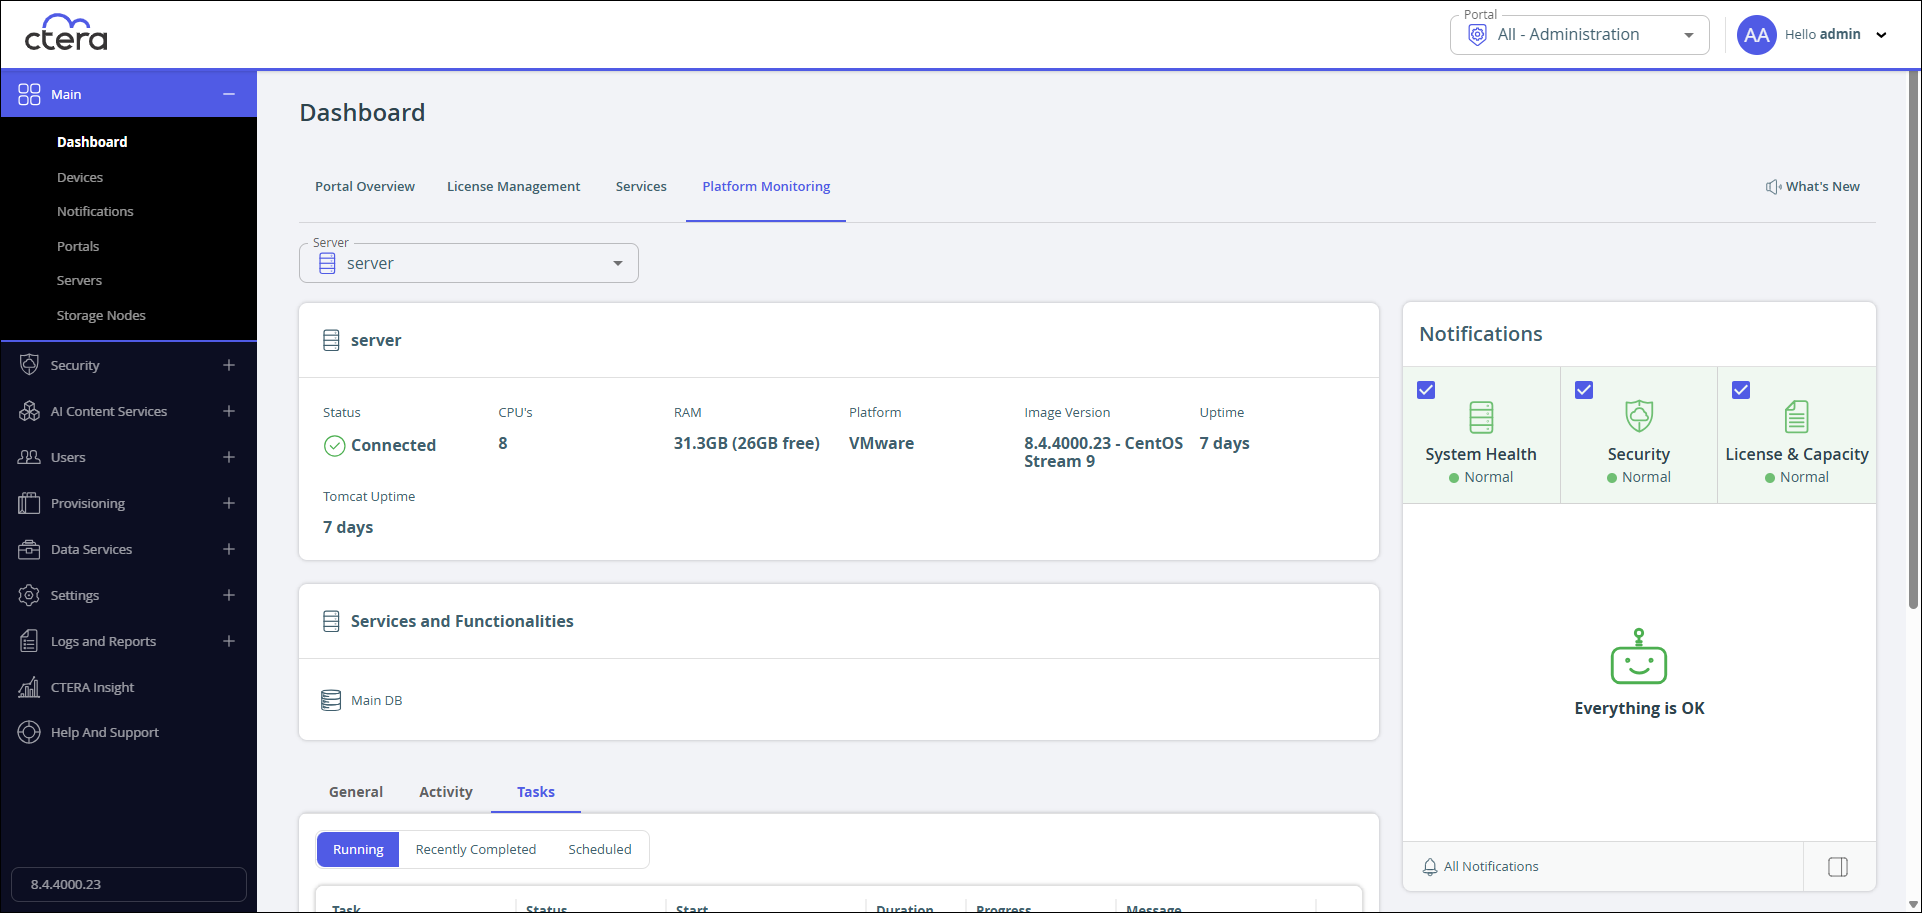
Server Details
The Server panel displays status information about the selected server, including the platform and image version, and how long the server has been running.

Services and Functionalities
The Services and Functionalities panel displays the services and functionalities set for the selected server. For details, see the Services and Functionalities section in Editing Server Settings.

General, Activity and Tasks Monitoring
The following tabs are available:
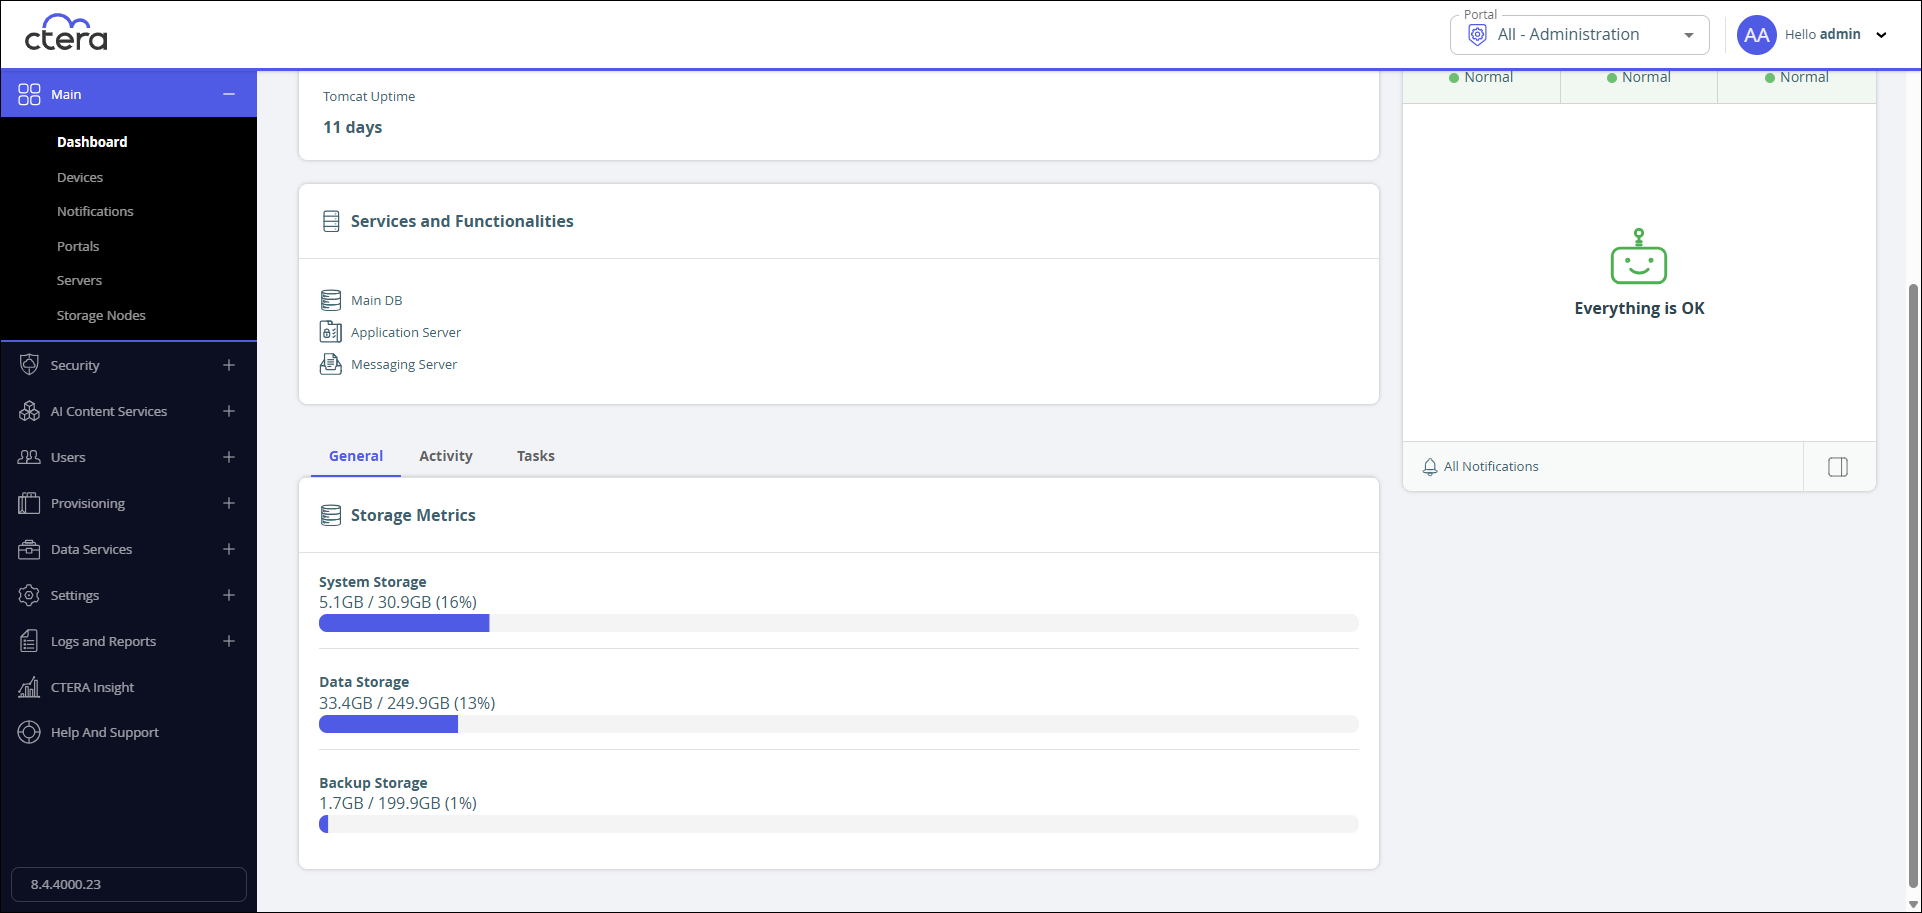
General
The General tab displayes the storage used for the system, for the data, and for backups. The display includes the storage, the maximum storage and the percentage of the storage that is being used.
Activity
The Activity tab displays graphs and charts detailing the server activity.

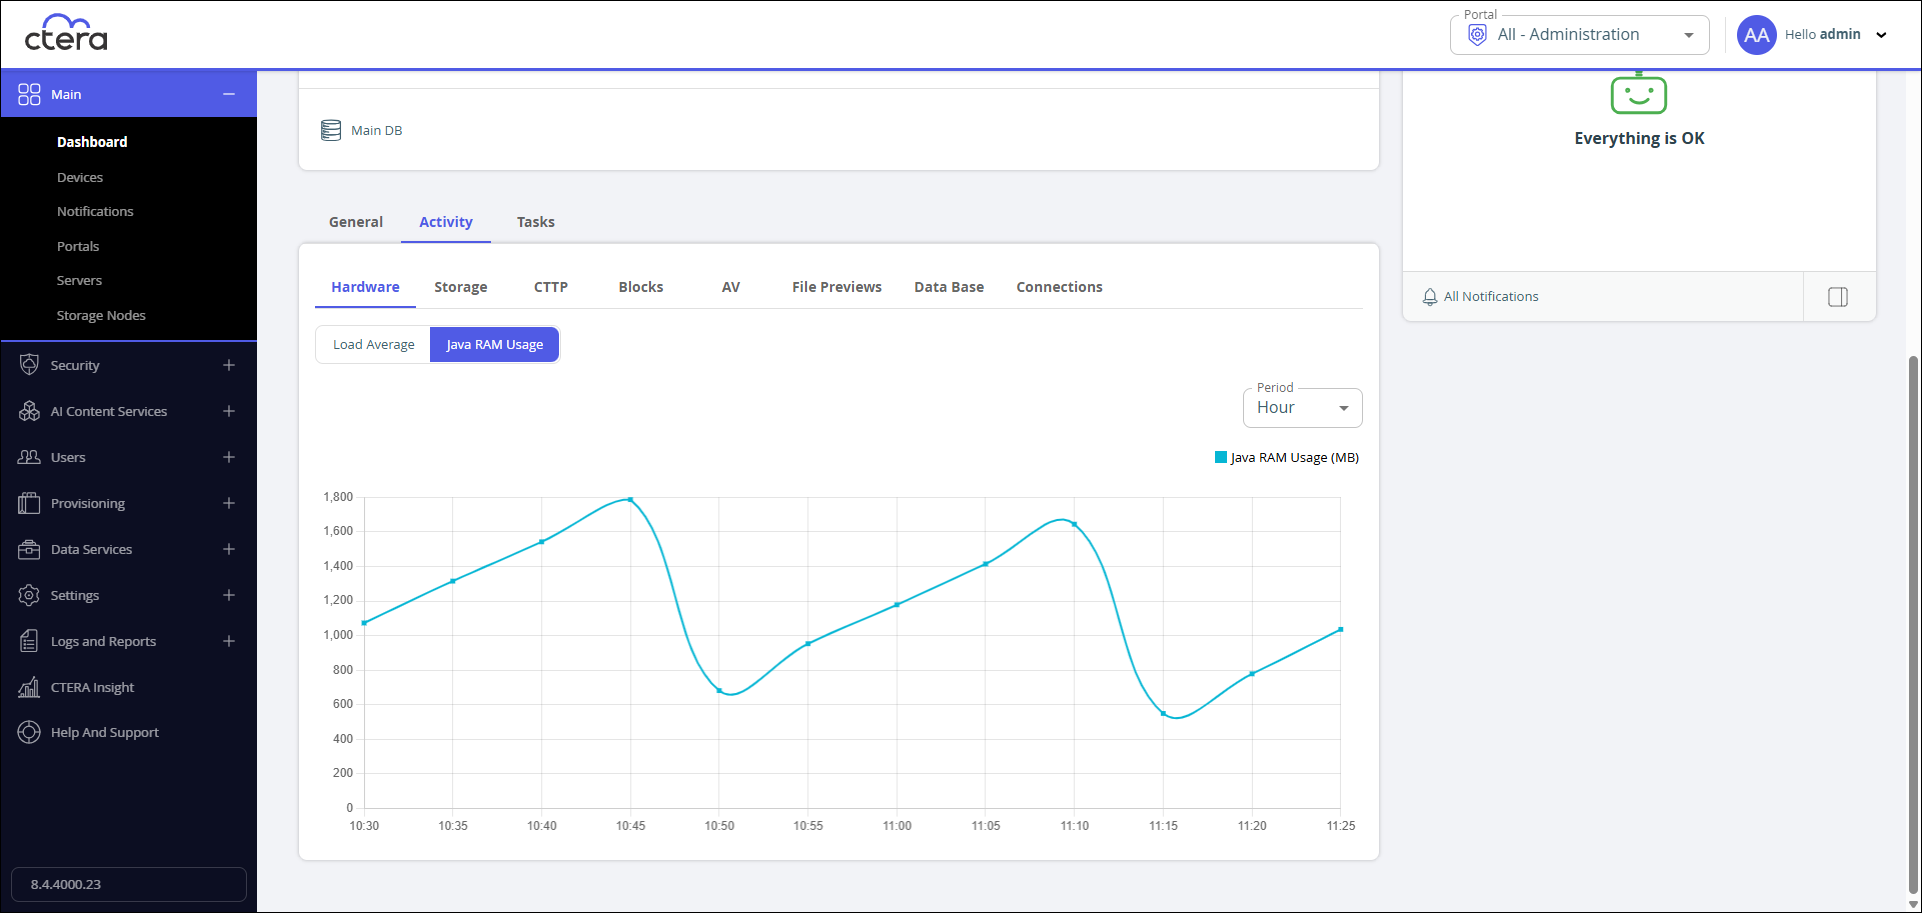
Hardware
The Hardware graph displays the server load average or the Java RAM usage.
Load Average – The server's average load over time. A server's load is the number of currently running processes that are using, or waiting to use, the CPU.
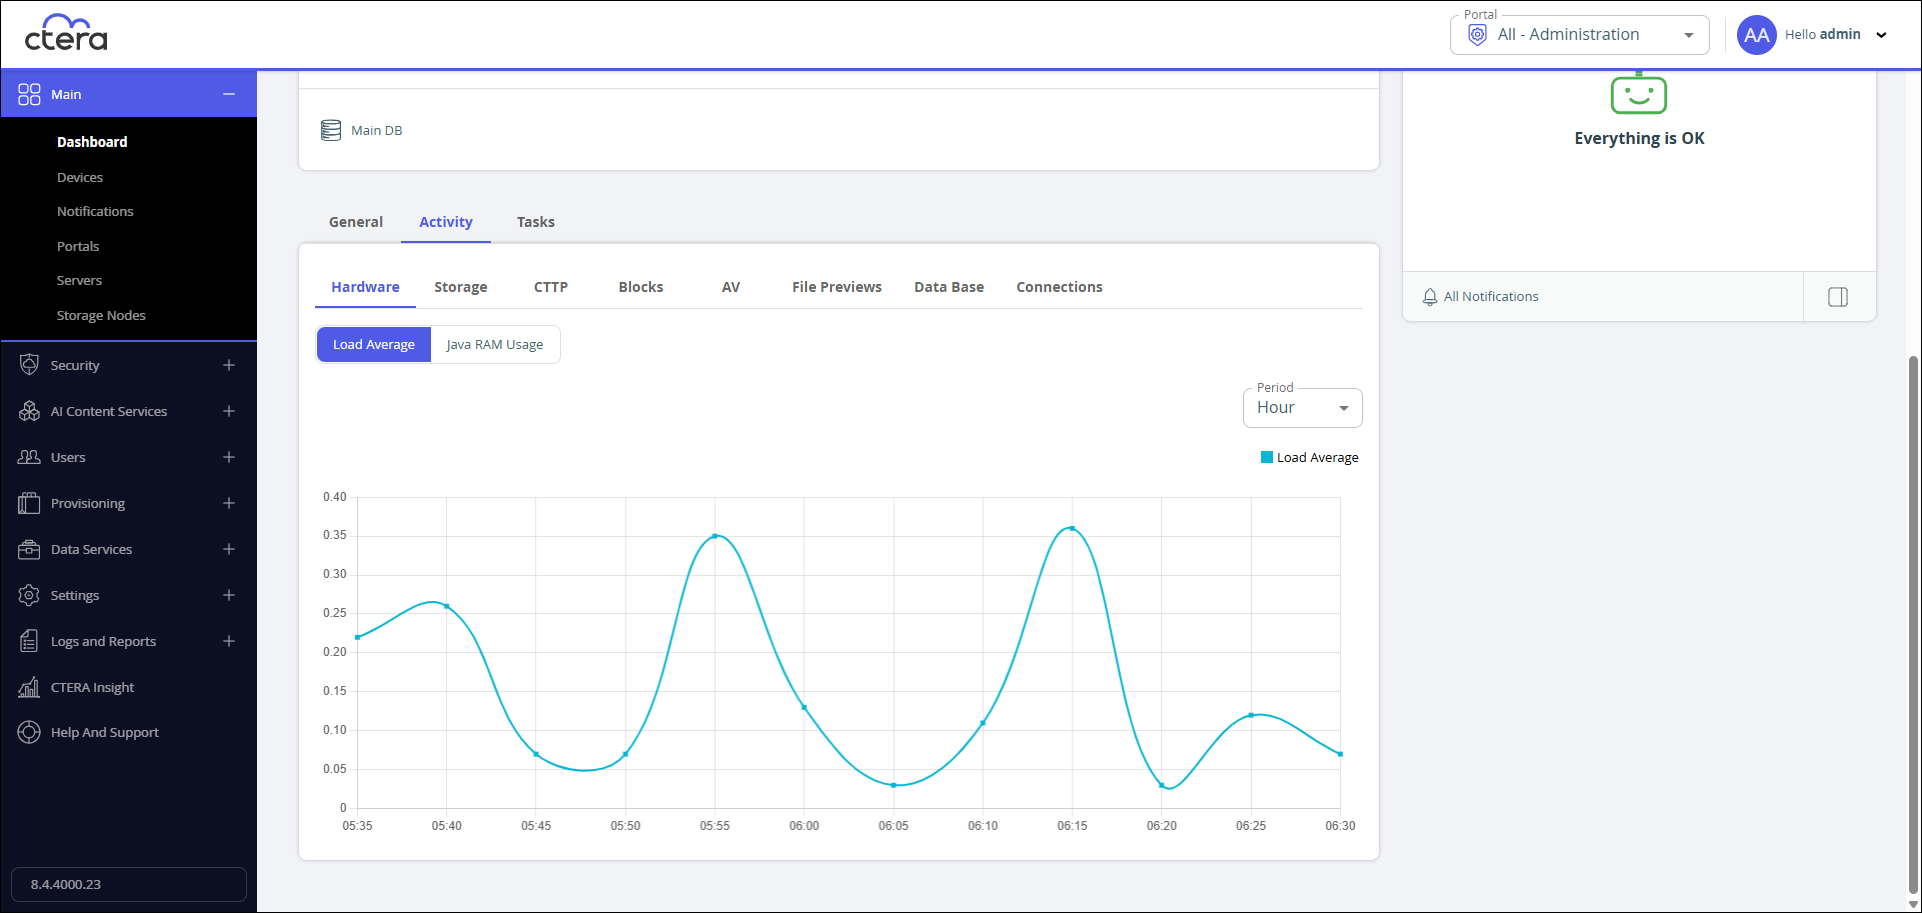
Java RAM Usage – The server's Java RAM usage in MB over time.
Storage
The Storage graph displays storage movement: traffic, I/O, migration traffic and the blocks migrated.
Traffic – The incoming and outgoing storage traffic over time. To filter the graph click the storage traffic direction to either hide it or display it.
IO – The number of read and write operations performed by the CTERA Portal on cloud storage nodes. To filter the graph click the storage traffic direction to either hide it or display it.
Migration Traffic – The amount of storage node migration traffic.
Blocks Migrated – The number of blocks migrated in storage node migration.
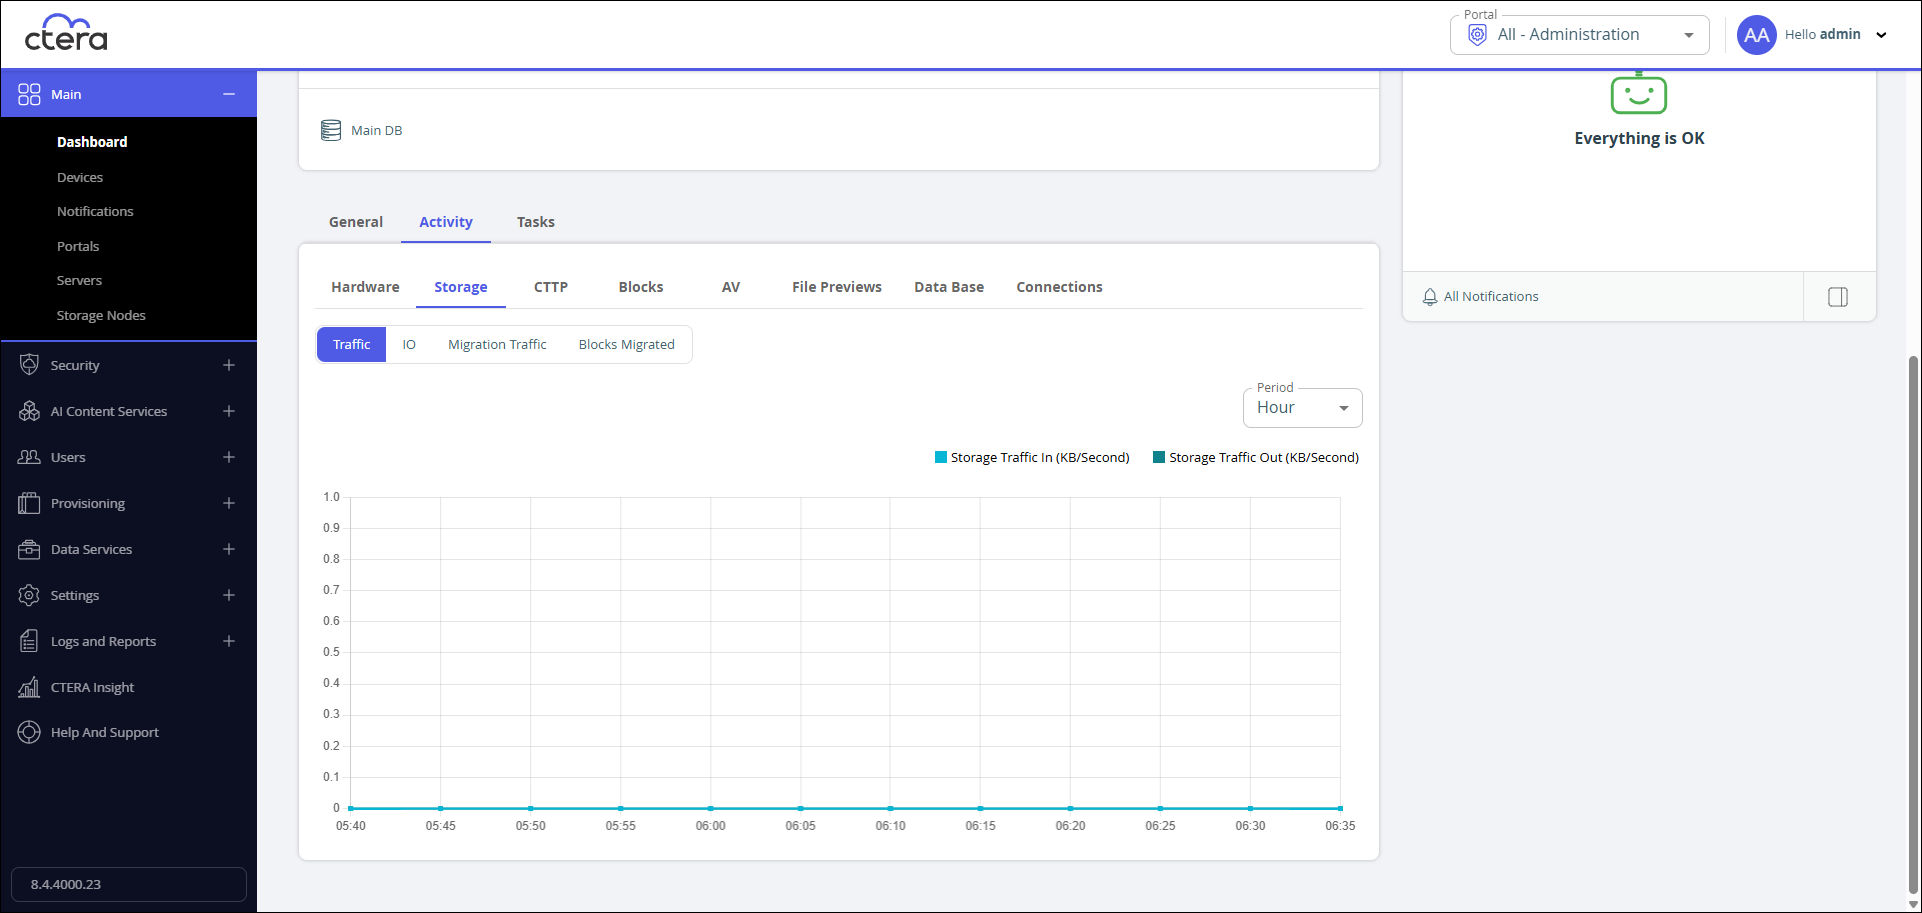
In the Period drop down, select the time period to display: hour, day, or week.
CTTP
The CTTP graph displays the inbound and outbound CTTP traffic over time. To filter the graph click the CTTP traffic direction to either hide it or display it.
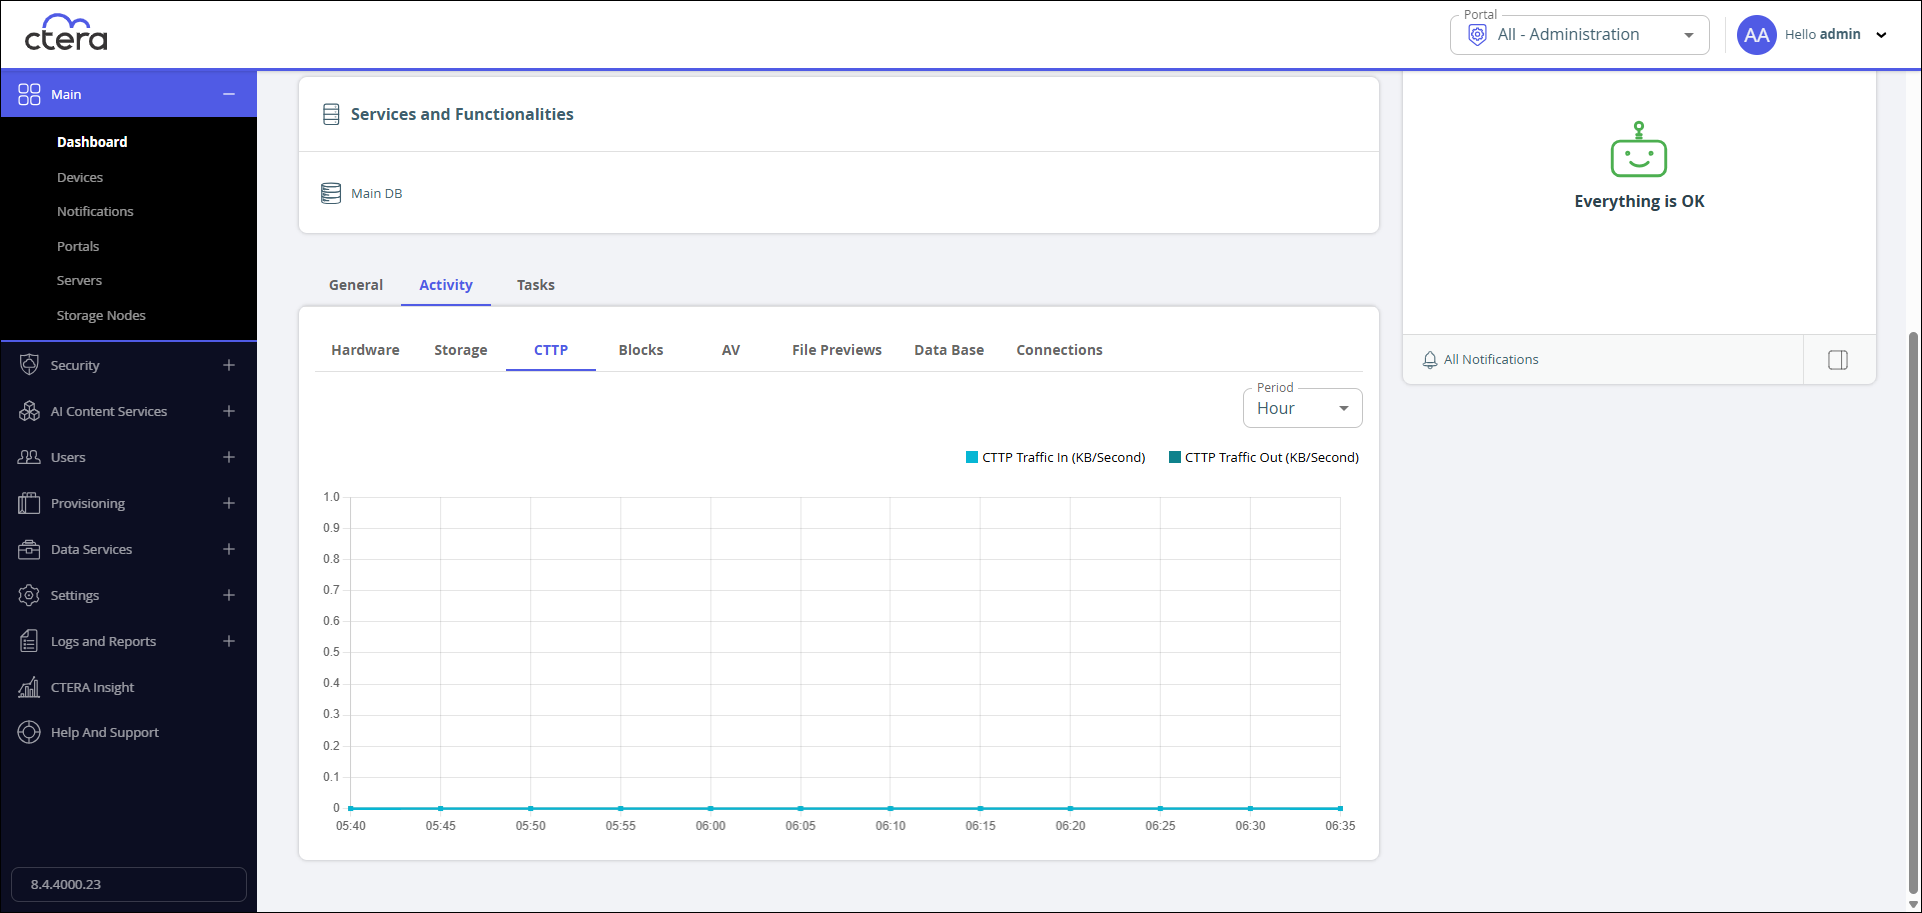
In the Period drop down, select the time period to display: hour, day, or week.
Blocks
The Blocks graph displays block information.
Cleaned – The number of blocks cleaned per second, as part of system maintenance.
Reclaimed – The number of blocks deleted per second, as part of system maintenance.
Verifications – The number of block verifications per minute. Block verifications are executed when the portal is executing a consistency check as part of system maintenance.
Mapfile Blocks Cleaned – The number of mapfile blocks cleaned per second, as part of system maintenance.

In the Period drop down, select the time period to display: hour, day, or week.
AV
The AV graph displays antivirus information.
Throughput – The amount of throughput by Cloud Drive antivirus.
Scanned Files – The number of files scanned by Cloud Drive antivirus. To filter the graph click the scanning option, on demand scan or background scan, to either hide it or display it.
Percentage of On-Demand Scans – The percentage of files scanned on demand.
Average Scan Time – The average time a scan takes.
Average Time to Start Scan – The average amount of time it takes for a scan to start.
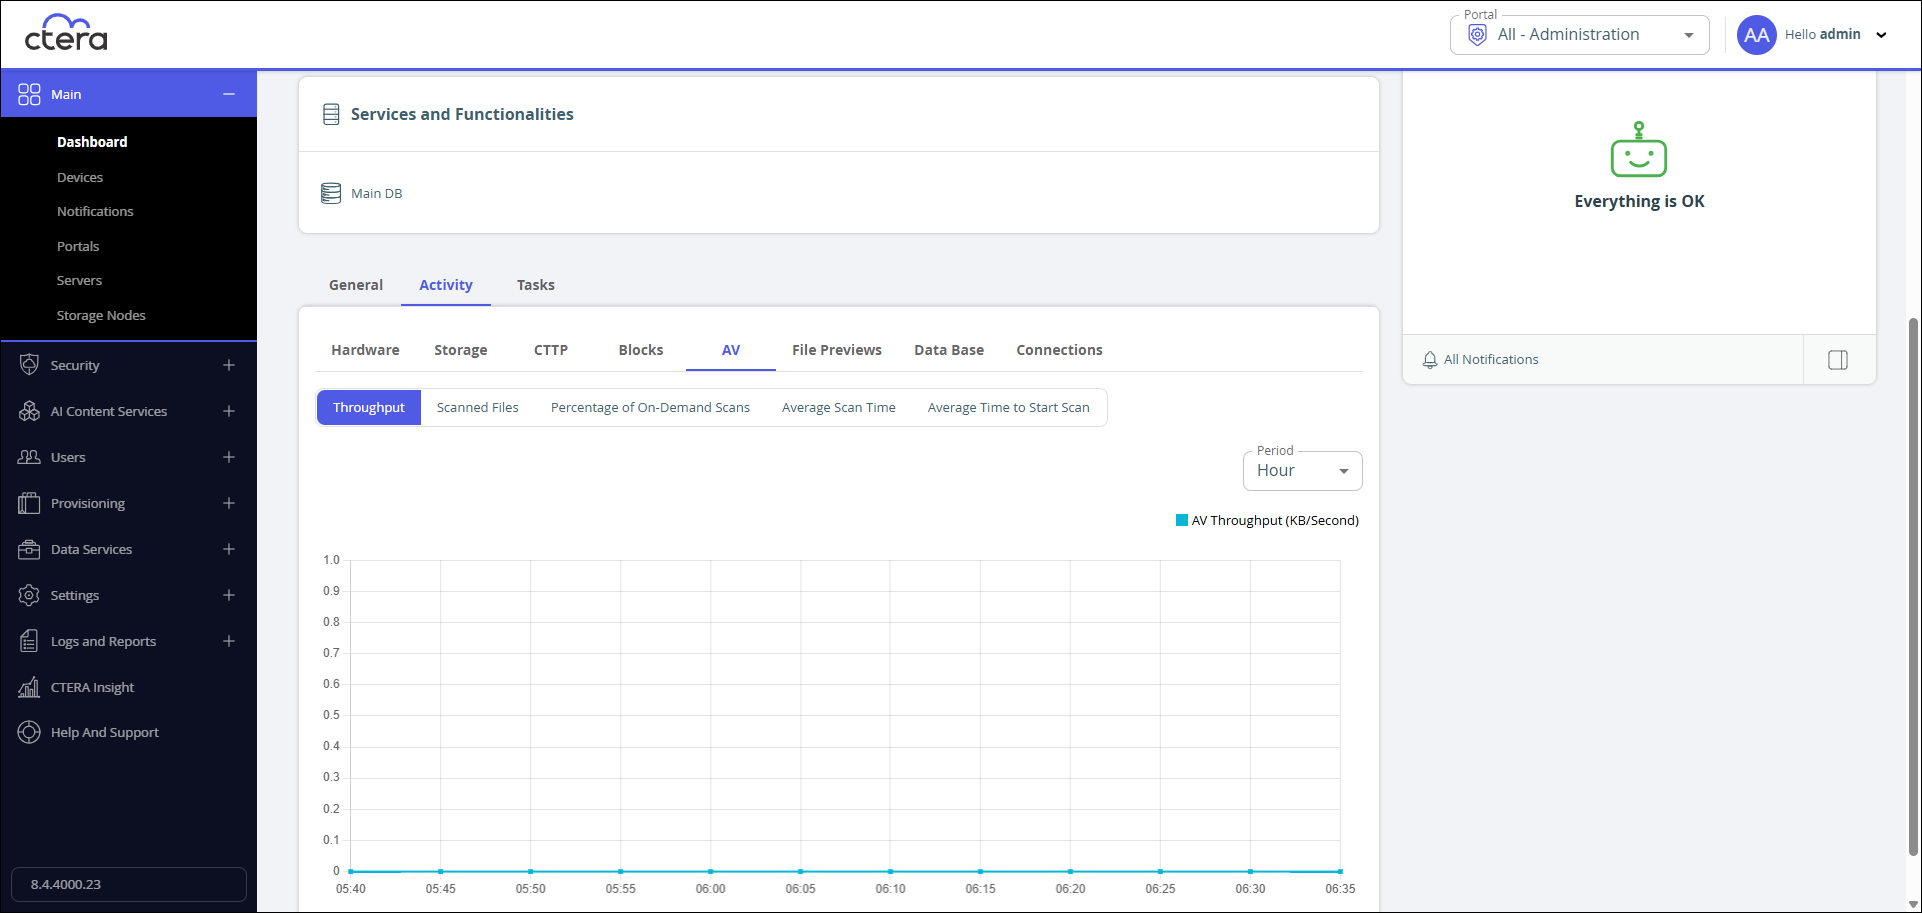
In the Period drop down, select the time period to display: hour, day, or week.
File Previews
The File Previews graph displays the files previewed per minute during the specified time period..
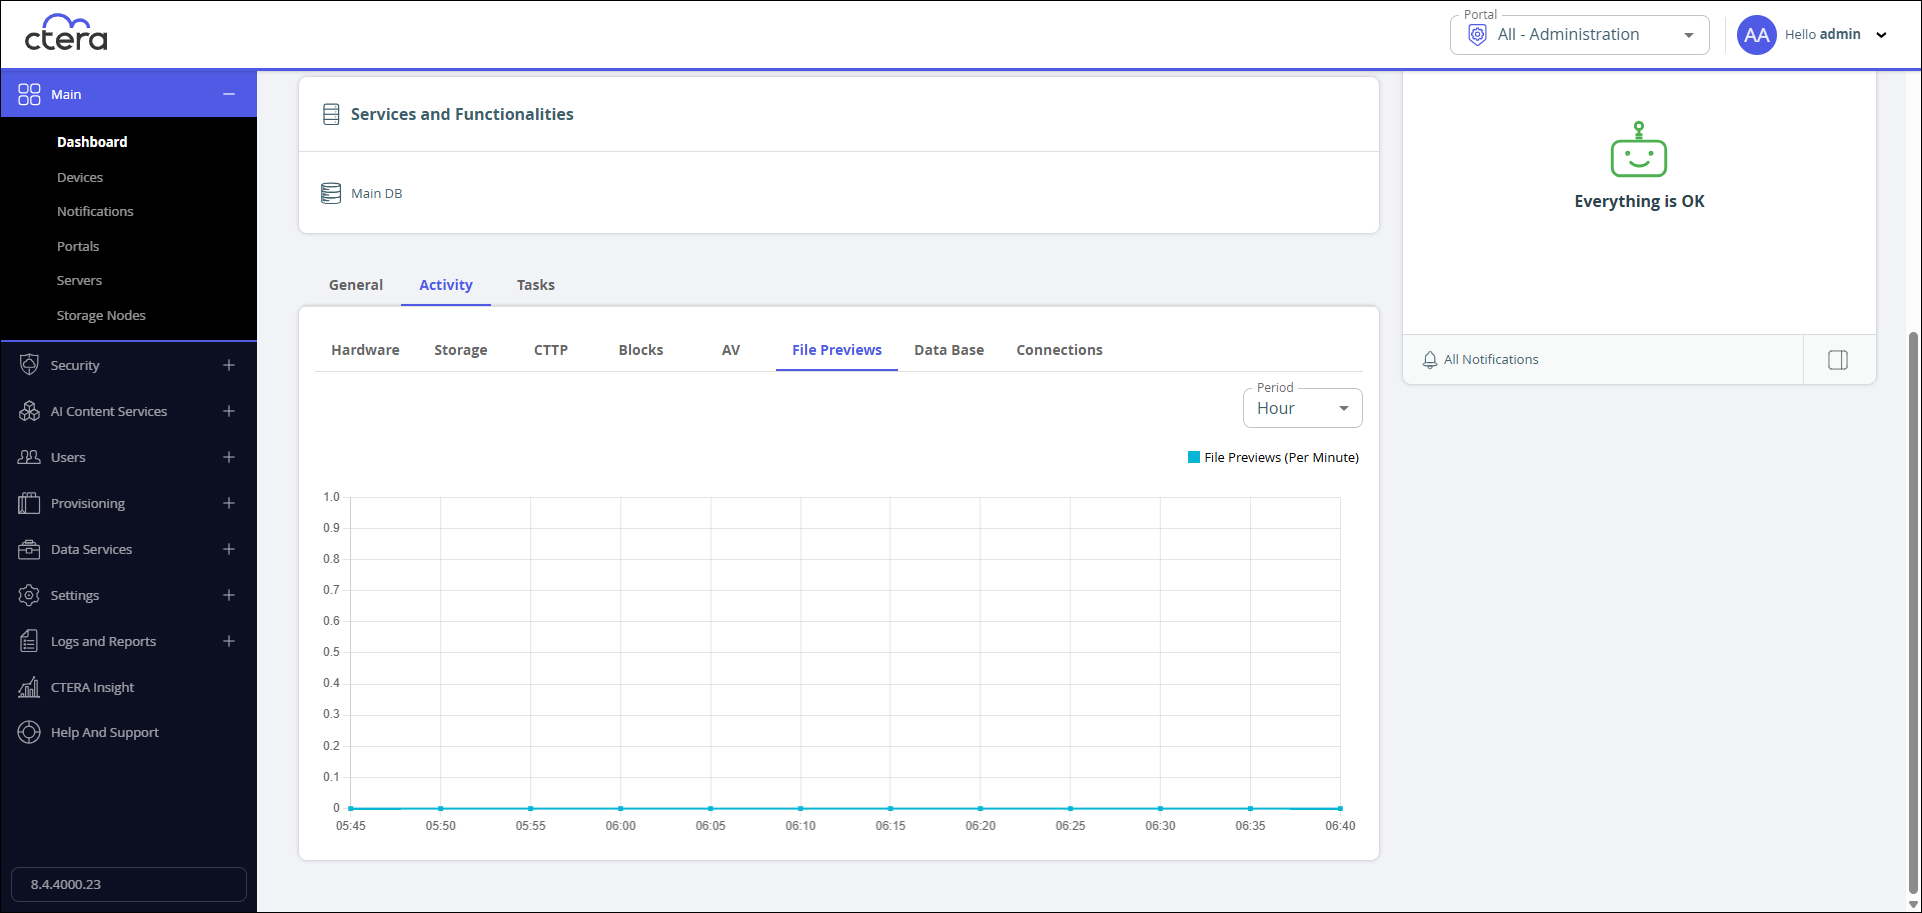
In the Period drop down, select the time period to display: hour, day, or week.
Data Base
The Data Base graph displays database connections and commit threads.
The Data Base graphs are only relevant for the main database and replication database servers.
Outbound Database Connections – The number of outbound database connections over time.
Inbound Database Connections – The number of inbound database connections over time.
Commit Threads – The number of threads running and waiting.
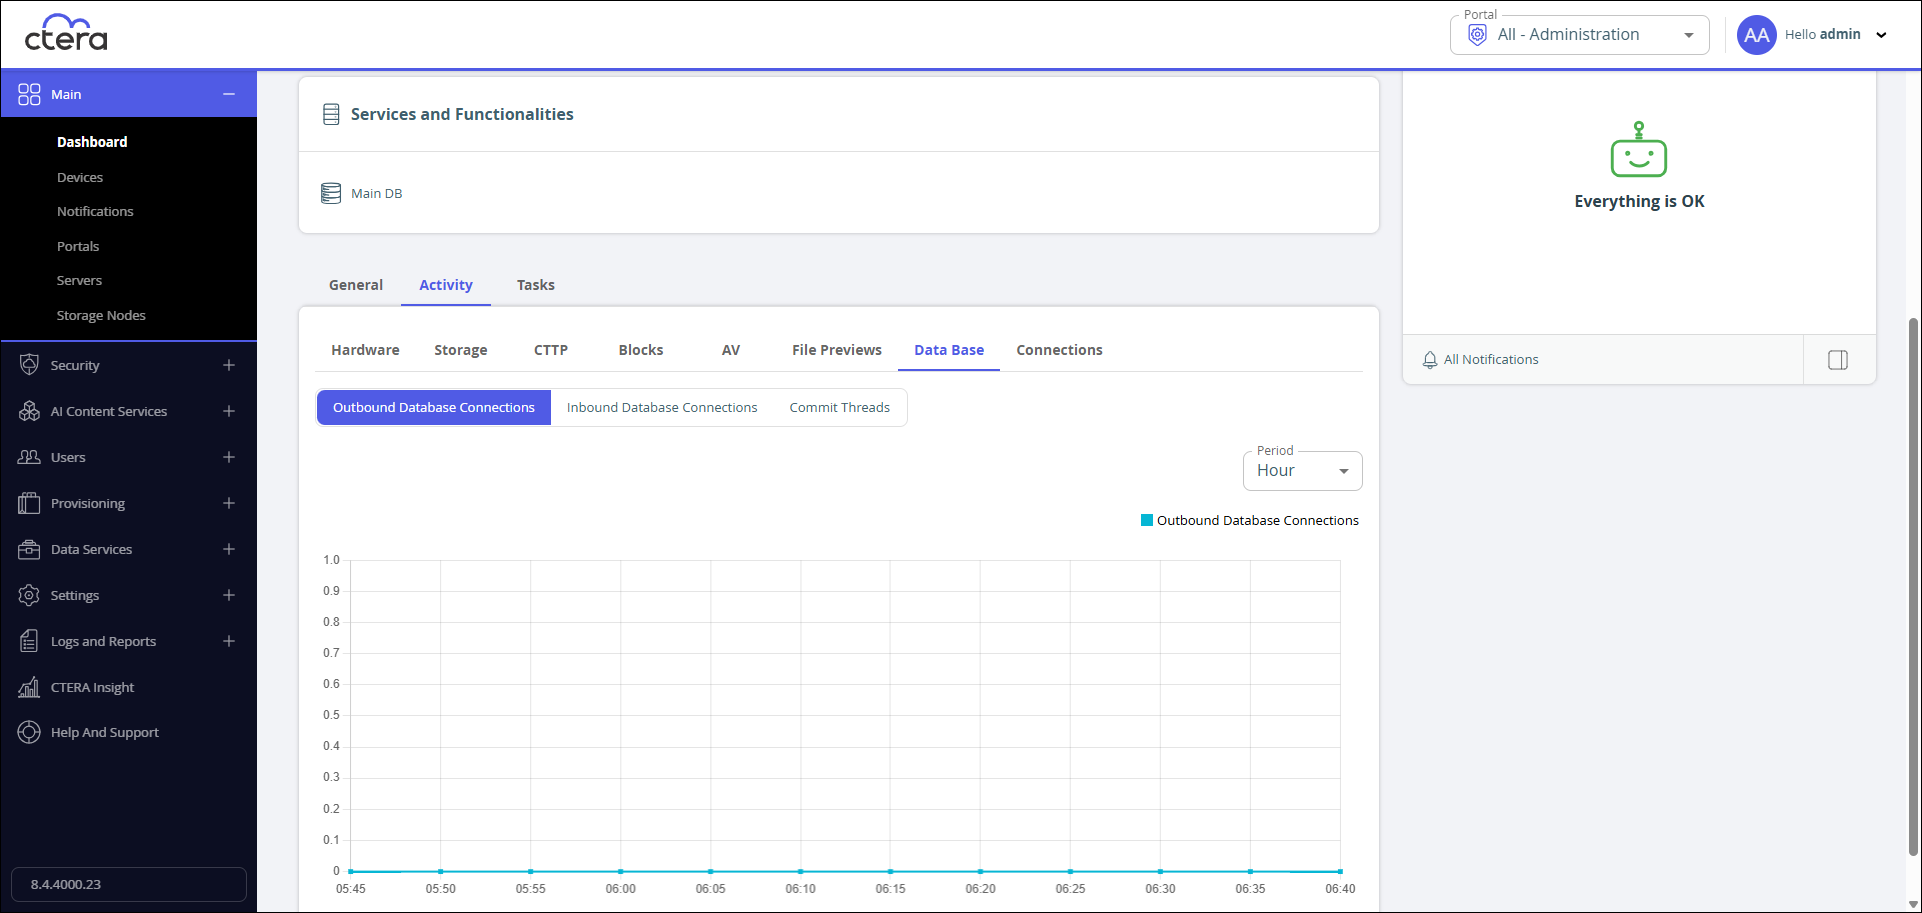
In the Period drop down, select the time period to display: hour, day, or week.
Connections
The Connections graph displays logged in users and connected devices.
Logged In Users – The number of CTERA Portal administrators logged in over time.
Connected Devices – The number of connected devices, such as edge filers, drive devices (Connect, Ahare, Protect, and Mobile), over time.
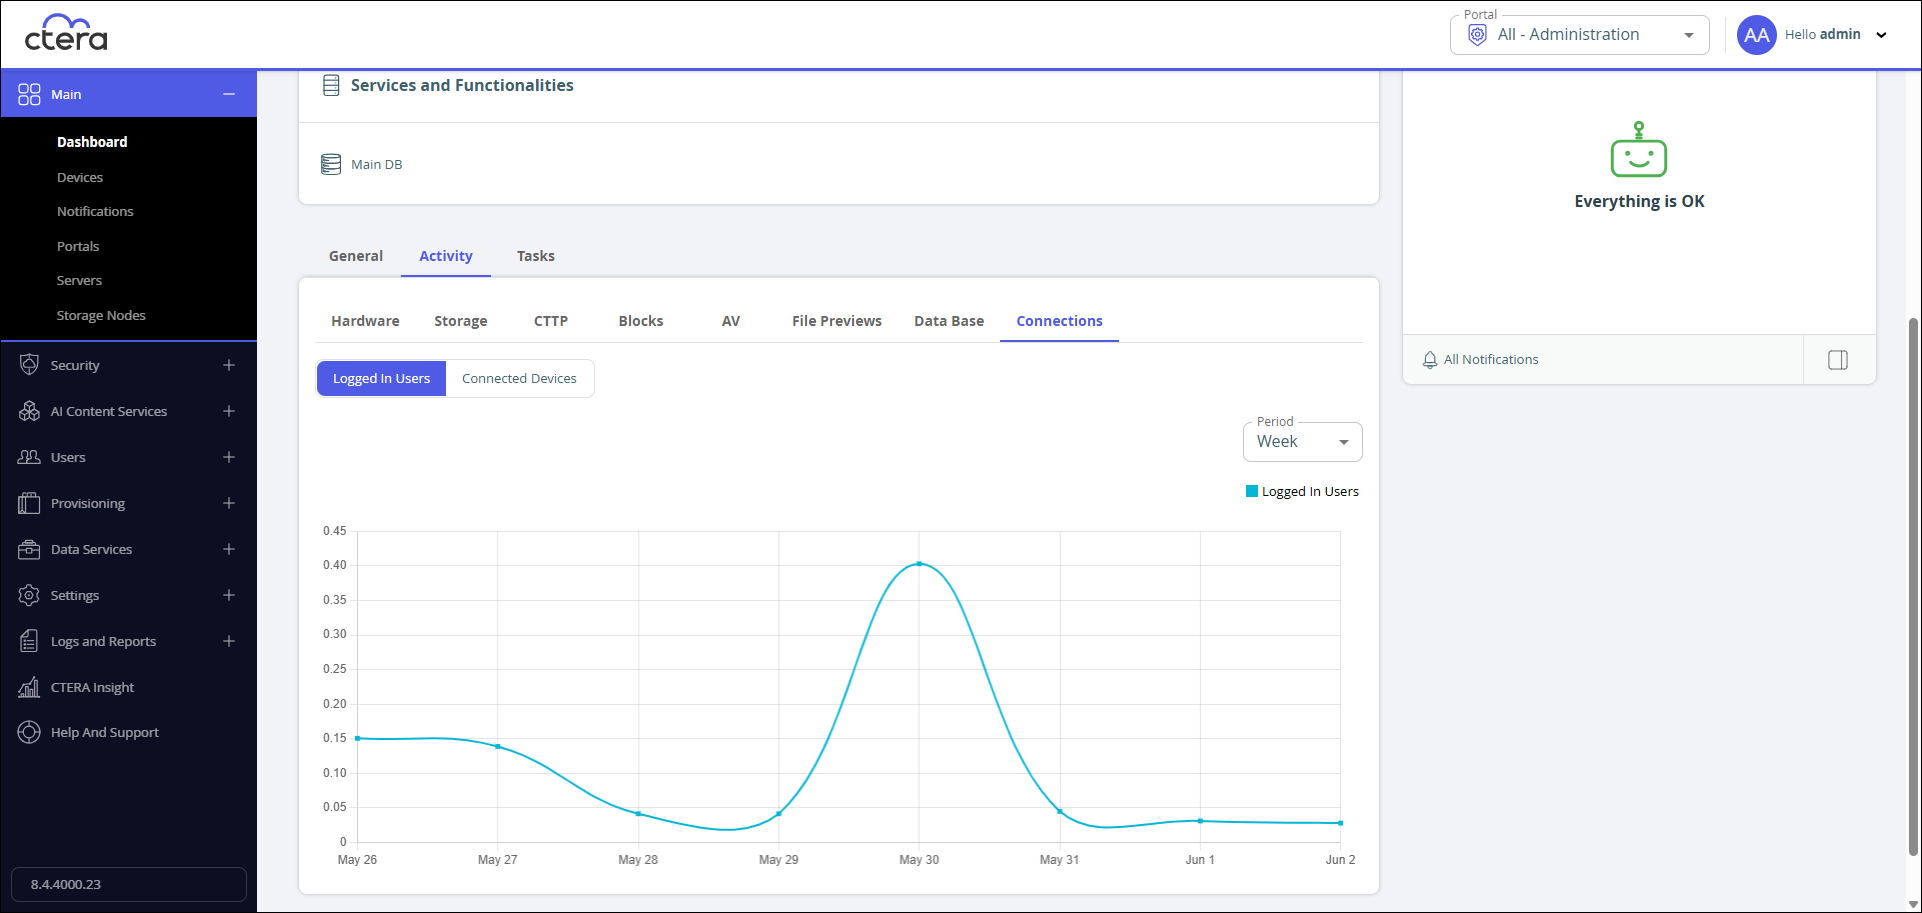
In the Period drop down, select the time period to display: hour, day, or week.
Tasks
The tasks: Running, Recently Completed, or Scheduled on the selected server.
The following information is displayed for each task.
Task – The name of the task.
Status – The task status, for running and completed tasks.
Start – The date and time at which the task started or will start for a scheduled task.
Duration – The amount of time the task took, or has taken so far for a running or completed task.
Progress – The task's progress for a running task.
Message – Additional information about the task for a running or completed task.
For details about these tasks, see List of the Main Tasks.