To edit server settings:
- In the global administration view, select Main > Servers in the navigation pane.
The Servers page is displayed, listing all the servers for the CTERA Portal.
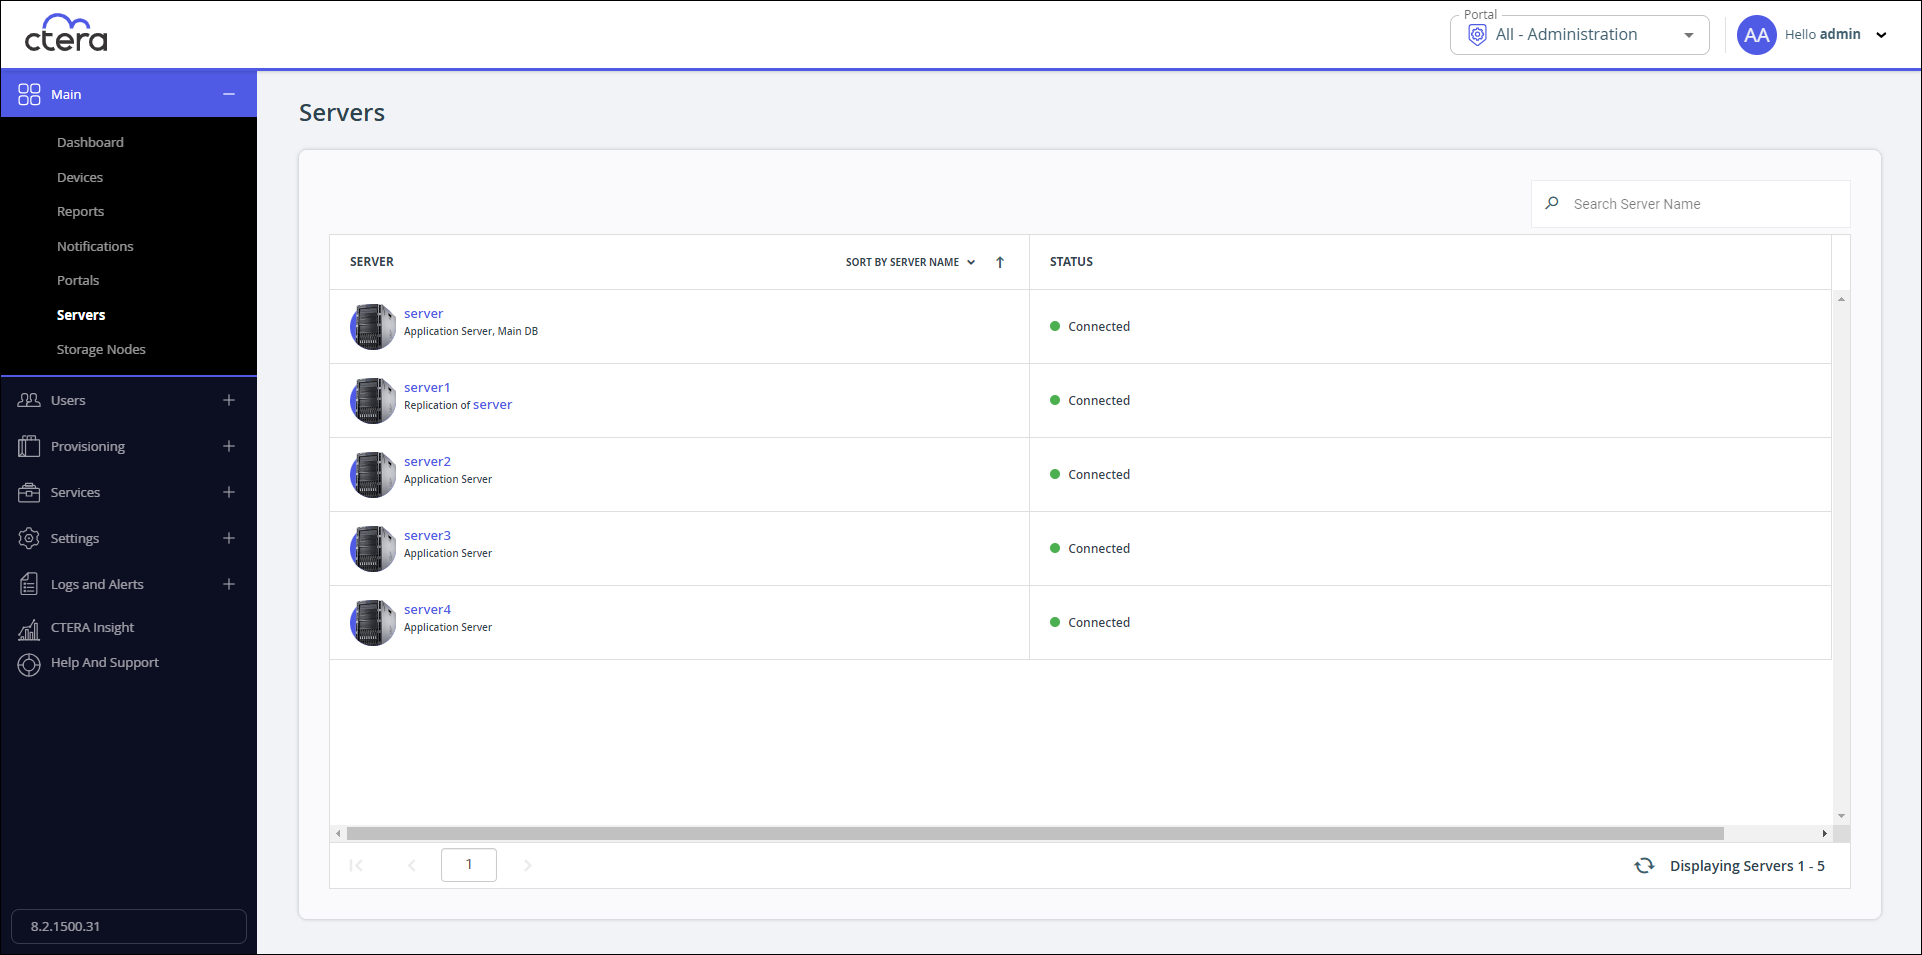
- Click the server to edit.
The server window is displayed with the server name as the window title. - Edit and monitor the following settings:
- General Settings
- Address Mappings
- Clients
- DB Replication - This option is only available for the main database and database replication servers.
- Activity
- Tasks
- Status
- Click Save.
General Settings
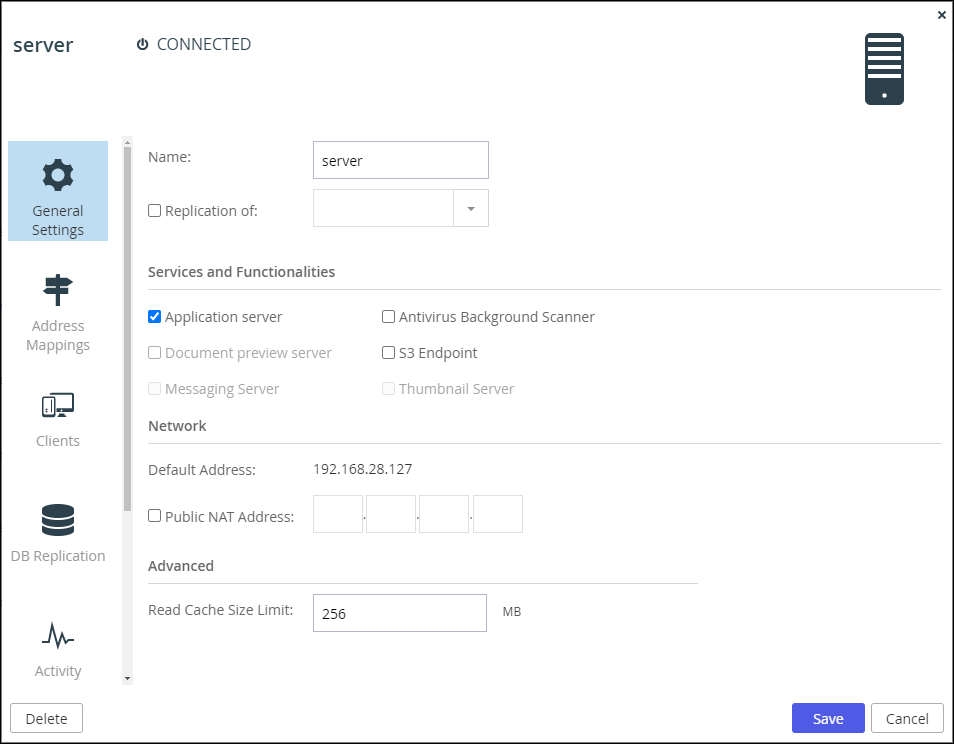
You can edit server settings, including configuring a server as an application server, setting the public IP address of the server, and the IP address to which each virtual portal's DNS should resolve. This allows you to restrict specific portals to be accessible only from a specific network interface.
The DB Replication option is only available for the main database and database replication servers.
In the General Settings option, you can edit the following settings:
Name – The unique name of the server.
Replication of – The server is a replication server of the specified server. Replication is configured when the server is installed.
Services and Functionalities
CTERA recommends the following when configuring server services:
- When possible,for high availability, HA, configure at least 2 servers for each server functionality.
- Do not overload the application servers by configuring too many server functionalities on the same server.
- Note specific requirements specified for each server functionality.
- Application server – The server is an application server. An application server accepts CTTP connections from CTERA Edge Filers and CTERA Drive Share/Protect (Agents) and HTTPS connections from end users and CTERA Drive Mobile. If unchecked, this server does not allow any logins. CTERA recommends designating at least two servers to act as application servers, for high availability. For details about CTTP, see What is the CTTP Transport Protocol.
In a production environment, the primary server hosts the CTERA Portal database, referred to as Main DB. In production this server and the server that hosts the replication database, referred to as Replication of main_db_server_name should not be defined as application servers. - Antivirus Background Scanner – An antivirus background scan runs on this server.Note
CTERA recommends that the background scanning servers are not application servers.
- Document preview server – The server is a document preview server. CTERA recommends designating at least two servers for generating document previews, for high availability. When a server is defined as a document preview server, the other server type options are disabled. Document previews are requested by end users from the end user portal's Web interface, the Cloud Drive, and backup folders. When a user clicks on a file’s name or icon in one of these locations, the file is displayed in the online viewer.Note
You have to uncheck Application server before you can check Document preview server. After checking Document preview server, you need to restart the server.
- S3 Endpoint – The server supports access to cloud drive folders from an S3 browser. For details, see Setting Up Access to Portal Content From an S3 Browser.Note
Checking the S3 Endpoint is required on only one server. For high availability, you can set the S3 Endpoint on more than one server.
- Messaging Server – The server will also act as a messaging server. For details about the CTERA Messaging service and server requirements, see Managing the CTERA Messaging Service.
- Thumbnail Server – The server will also act as a thumbnail server. For details about the Thumbnail service, see Managing the Thumbnail Service.
Network
- Default Address – The default IP address of the server.
- Public NAT Address – The default IP address has a public Network Address Translation (NAT). Specify the public IP address. This controls the default IP address of this server that is exposed using DNS.
Advanced
- Read Cache Size Limit – The maximum amount of server RAM to allocate to the read cache that is used to accelerate reads from the storage nodes. Recently read blocks are kept in the cache to avoid repetitive requests from the storage node. When the cache fills up, the blocks that have been in the cache the longest are removed.
Address Mappings
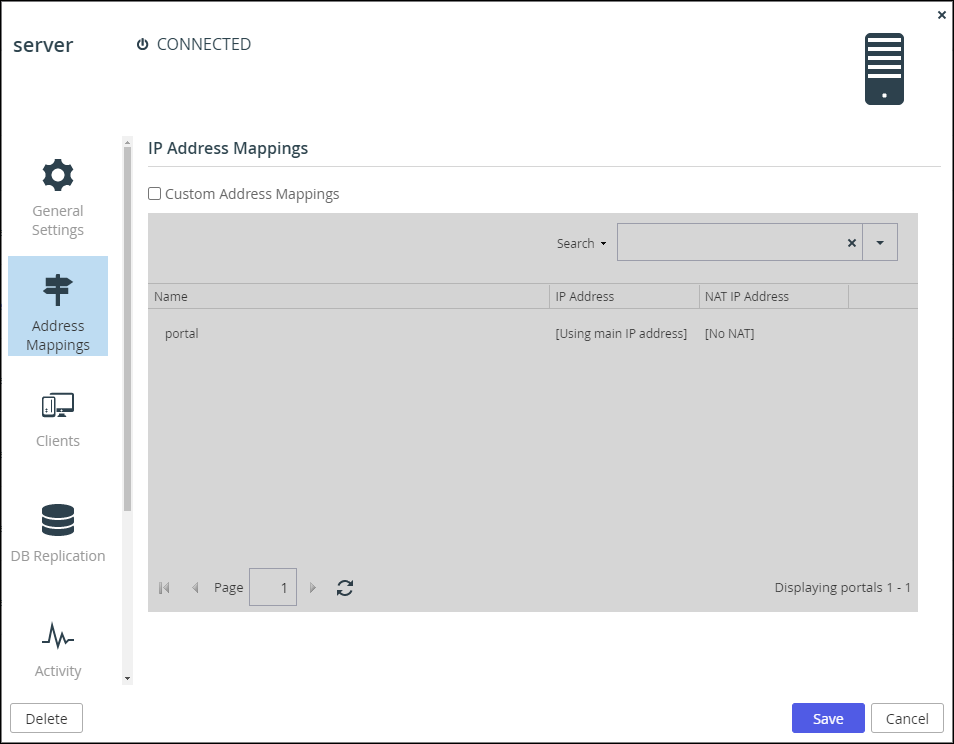
By default, CTERA Portal listens to team portals on the default address. You can optionally bind specific team portals to other interfaces (specified by IP address) of the server, which will cause this IP address to be published by the DNS server, and will prevent access to the specified portal via other IP addresses of the server.
The DB Replication option is only available for the main database and database replication servers.
To set custom address mappings:
- Check Custom Address Mappings.
You can edit the following settings:
- IP Address – The IP address for the team portal bound to an IP address of the server. If the virtual portal uses the default IP address,
Using main IP addressis displayed. You can change this to an IP address of the local interface to accept connections for clients. - NAT IP Address – If NAT is used, and the public IP address of the interface differs from the private IP address, specify the IP address to which the original IP address should be translated. This public address will be published by the CTERA Portal DNS server. To bind this team portal to the default IP address, do not enter a value in this field. To specify that the public IP address is equal to the private IP address, do not enter a value in this field.
Clients
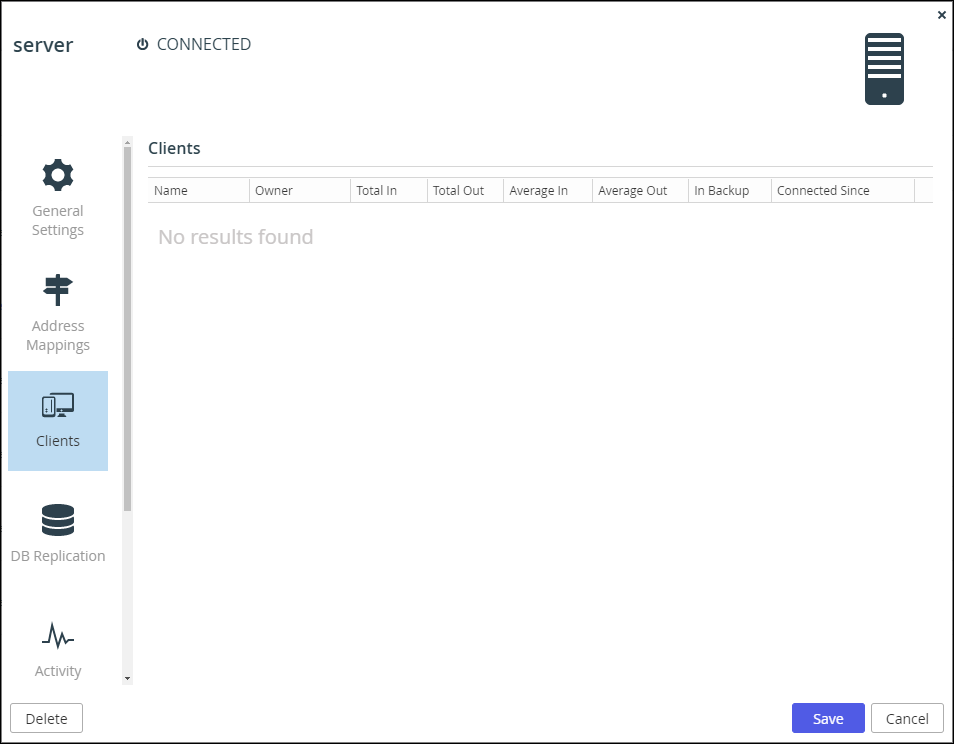
You can view information about a server's currently connected devices.
The DB Replication option is only available for the main database and database replication servers.
In the Clients option, you can view settings for currently connected devices:
- Name – The name of the client device.
- Owner – The name of the client device's owner.
- Total In – The total CTTP traffic sent from the client device to the virtual portal.
- Total Out – The total CTTP traffic sent from the virtual portal to the client device.
- Average In – The average speed, throughput, of traffic sent from the client device to the virtual portal in bytes/second.
- Average Out – The average speed, throughput, of traffic sent from the virtual portal to the client device in bytes/second.
- In Backup – The client device is currently backing up files to the CTERA Portal. Devices in backup display
 , otherwise, no icon is displayed.
 - Connected Since – The date and time when the connection started.
DB Replication
This option is only available for the main database and database replication servers.
You can monitor the performance of the database backup and replication by selecting the DB Replication tab in the server window.
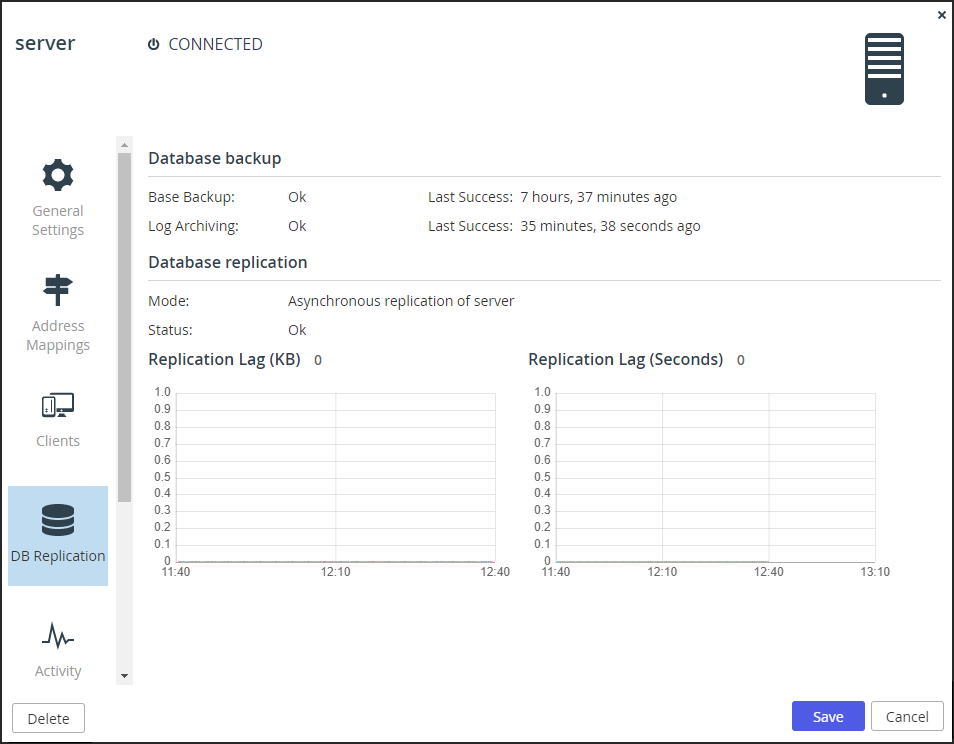
The portal reports the status of its scheduled base backups and transaction log archiving process, as well as additional metrics to help detect when database replication falls behind due to lags in the process. In the event that replication falls behind, portal administrators are notified via email. The relevant email templates are Replication setup failed and Replication has errors.
Activity
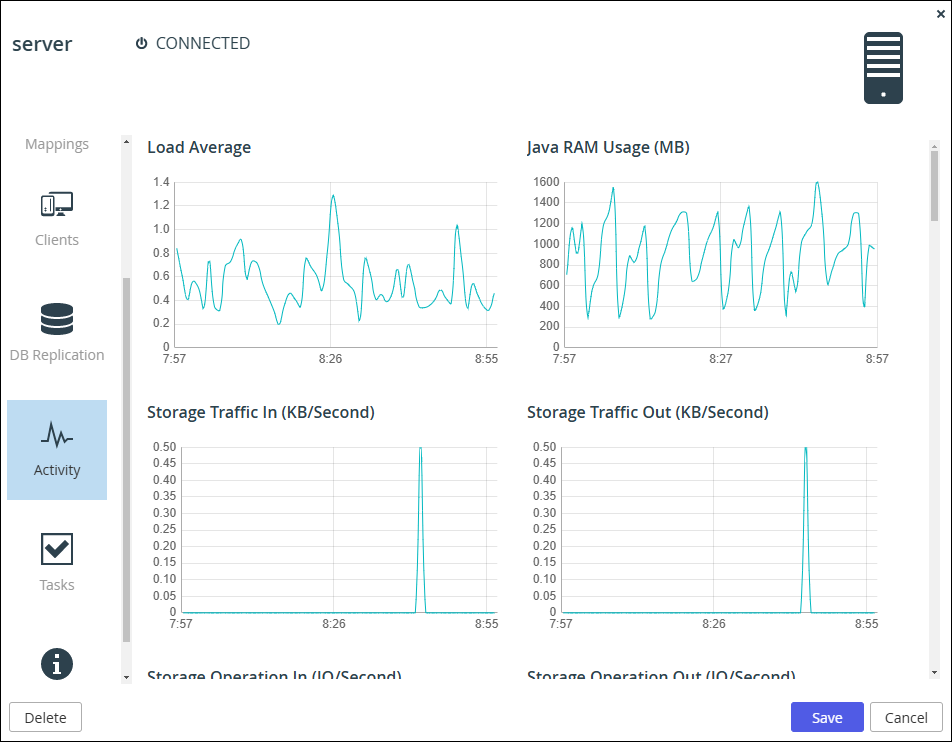
You can view charts displaying a server's activity data.
The DB Replication option is only available for the main database and database replication servers.
In the Activity option, you can view the following:

- Load Average – The server's average load over time. A server's load is the number of currently running processes that are using, or waiting to use, the CPU.
- Java RAM Usage (MB) – The server's Java RAM usage in MB over time.
- Storage Traffic In (KB/Second) – The incoming storage traffic over time.
- Storage Traffic Out (KB/Second) – The outgoing storage traffic over time.
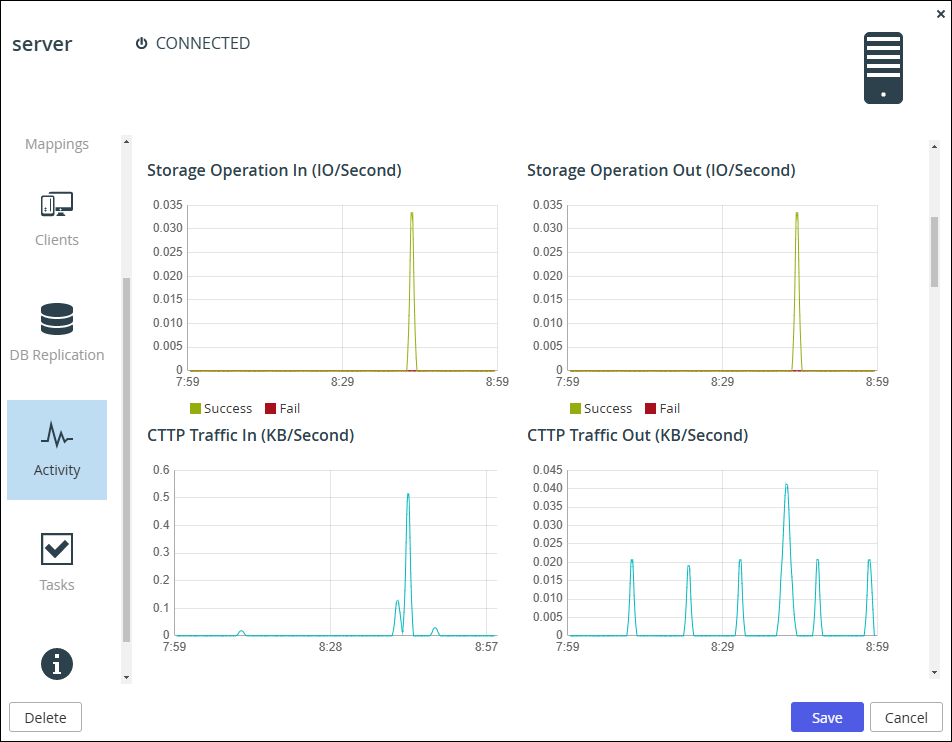
- Storage Operation In (IO/Second) – The number of read operations performed by the CTERA Portal on cloud storage nodes.
- Storage Operation Out (IO/Second) – The number of store operations performed by the CTERA Portal on cloud storage nodes.
- CTTP Traffic In (KB/Second) – The incoming CTTP traffic over time.
- CTTP Traffic Out (KB/Second) – The outgoing CTTP traffic over time.
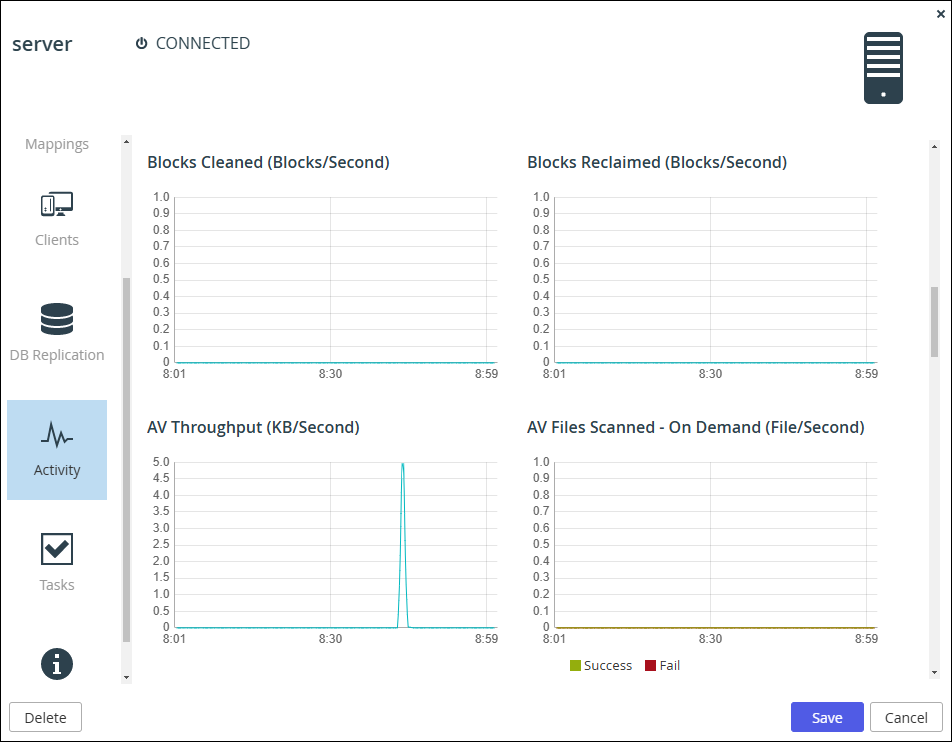
- Blocks Cleaned (Blocks/Second) – The number of blocks cleaned per second, as part of system maintenance.
- Blocks Reclaimed (Blocks/Second) – The number of blocks deleted per second, as part of system maintenance.
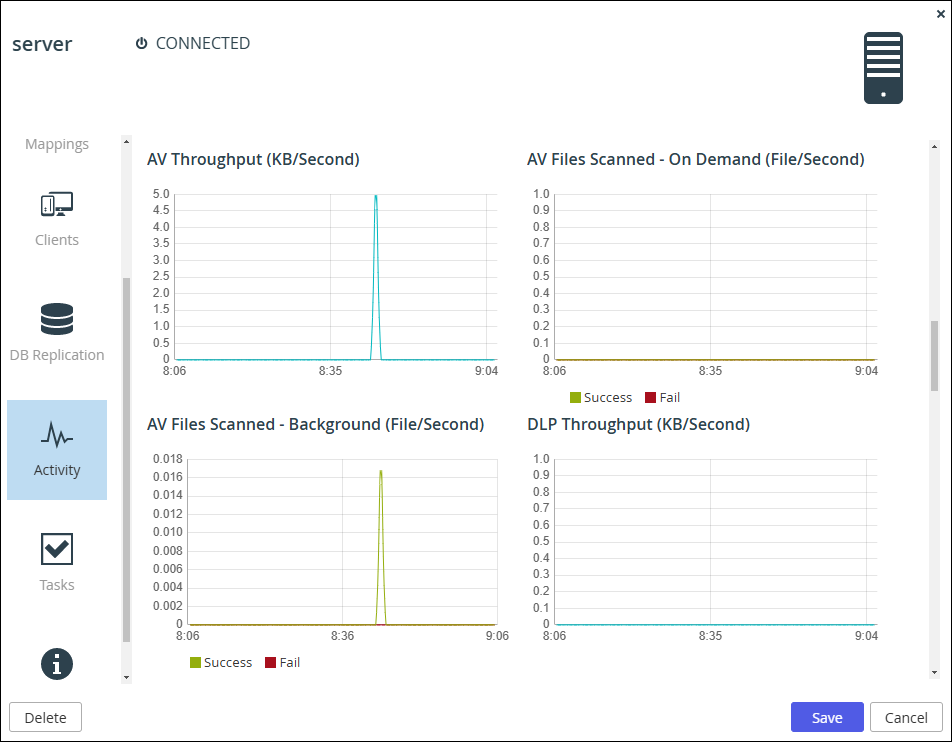
- AV Throughput (KB/Second) – The amount of throughput by Cloud Drive antivirus.
- AV Files Scanned - On Demand (File/Second) – The number of files scanned by Cloud Drive antivirus.
- AV Files Scanned - Background (File/Second) – The number of files scanned by the background scan.
- DLP Throughput (KB/Second) – This feature is currently not supported.
- DLP Files Scanned - On Demand (File/Second) – This feature is currently not supported.
- Block Verifications (Per Minute) – The number of block verifications per minute. Block verifications are executed when the portal is executing a consistency check as part of system maintenance.
- Commit Threads – The number of threads running and waiting.
- File Previews (Per Minute) – The number of files previewed per minute.
- Storage Migration Traffic (KB/Second) – The amount of storage node migration traffic.
- Blocks Migrated (Blocks/Second) – The number of blocks migrated in storage node migration.
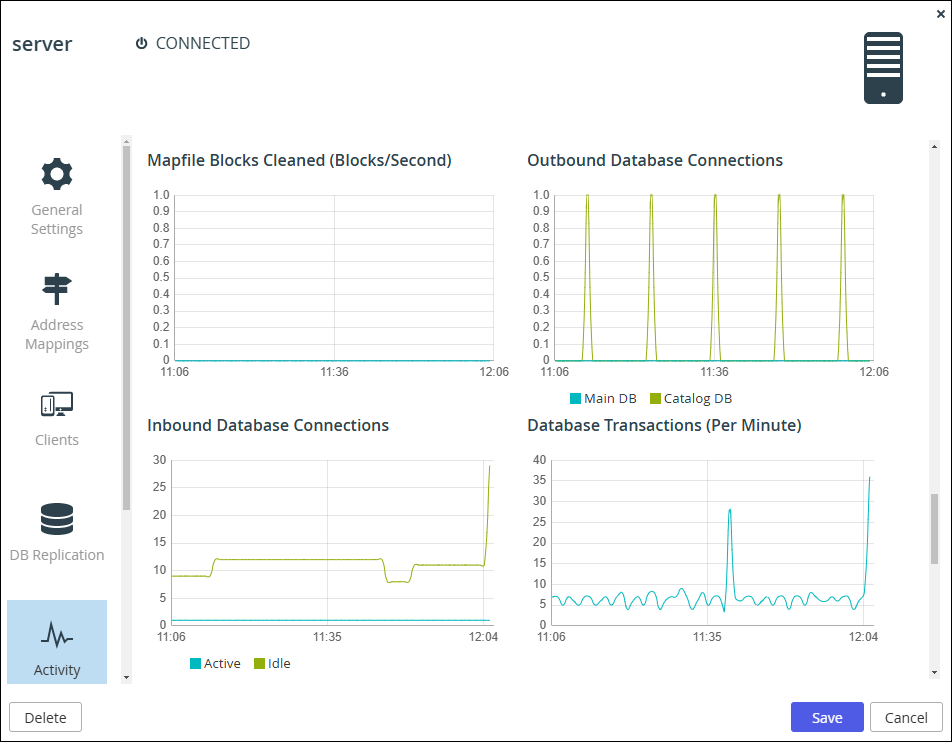
- Mapfile Blocks Cleaned (Blocks/Second) – The number of mapfile blocks cleaned per second, as part of system maintenance.
- Outbound Database Connections – The number of outbound database connections over time.
- Inbound Database Connections – The number of inbound database connections over time.
- Database Transactions (Per Minute) – Database transactions per minute.
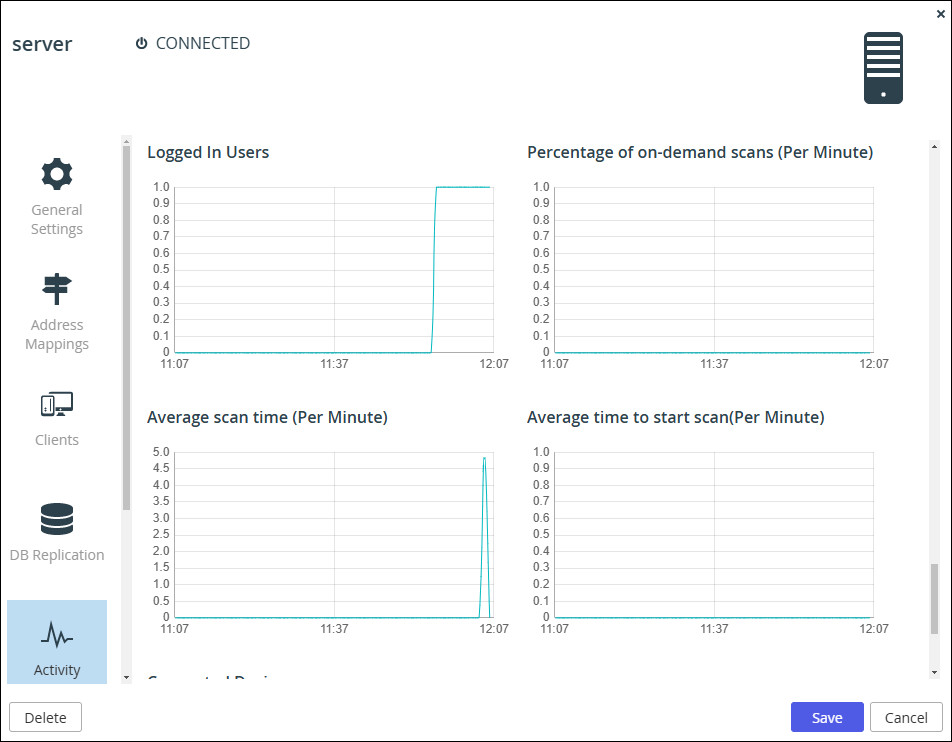
- Logged In Users – The number of CTERA Portal administrators logged in over time.
- Percentage of on-demand scans (Per Minute) – The percentage of on-demand scans.
- Average scan time (Per Minute) – The average scan time per minute.
- Average time to start scan (Per Minute) – The time required for on-demand scans to start the scan phase.
- Connected Devices – The number of connected client devices over time.
Tasks
You can view the server's currently running, completed, and scheduled tasks. These tasks run in background.
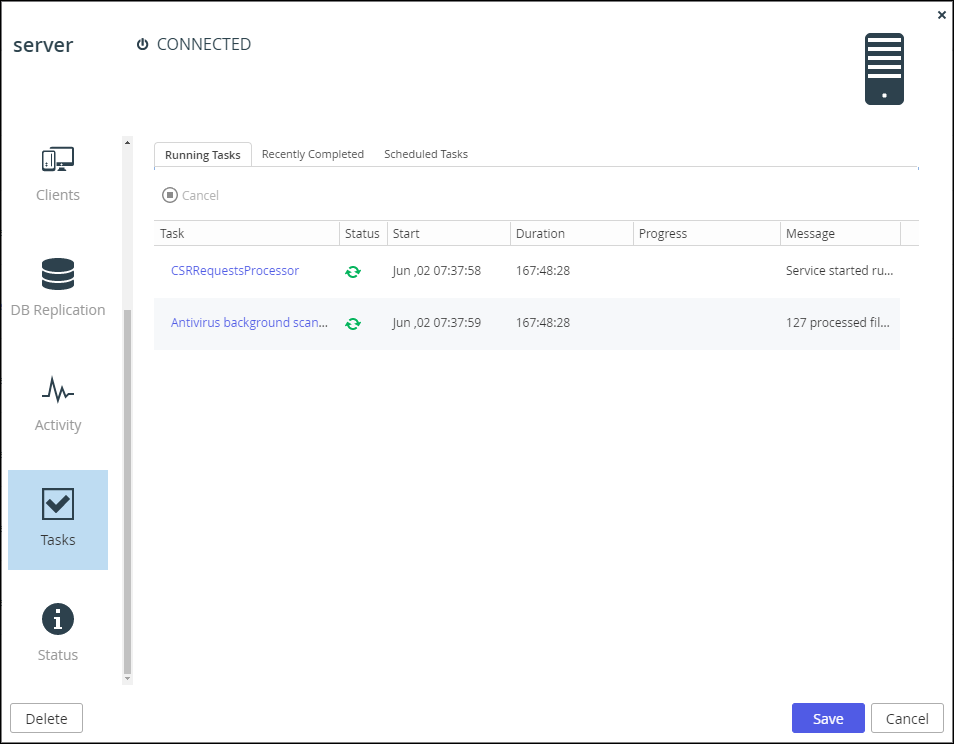
To view a server's tasks:
-
In the Tasks option, view the following:
Running Tasks tab – The currently running tasks.
Recently Completed tab – The tasks completed since the beginning of the day.
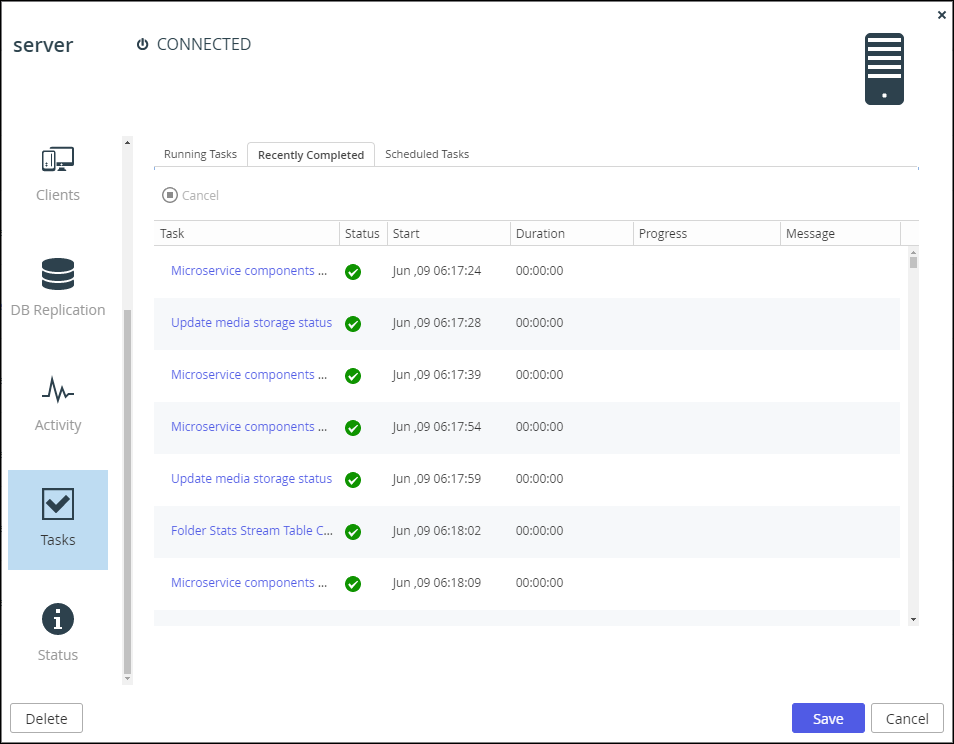
Scheduled Tasks tab – The scheduled tasks that have not started. The information displayed includes the date and time at which the task is scheduled to start.The following information is displayed for a task:
Task – The name of the task that is running, completed, or scheduled.
Status – The following icons are used for the task status of a running or completed task: – In progress.
 – Completed successfully.
 – Failed.
Start – The date and time at which the task started or will start for a scheduled task.
Duration – The amount of time the task took, or has taken so far for a running or completed task.
Progress – The task's progress for a running or completed task.
Message – Additional information about the task for a running or completed task.
List of the Main Tasks
| Task | Description | Server | Default Frequency |
|---|---|---|---|
| ACL Repair Tool | |||
| Administrator report generator | Generates administrator reports. | Application | Daily |
| Agent licensing refresh | Refreshes agent licensing. | Application | Ongoing |
| Alert sender | Generate and send emails, such as backup completed emails and log alerts. | Application | Every 60 seconds |
| Antivirus background scanning | Scan recently uploaded files for viruses in background. | — | Ongoing: After files are uploaded. If no files are uploaded, the scan stops for 30 seconds before checking again. Or, on demand |
| Antivirus re-scanning server | If a background scan has a file to scan when a rescan is initiated, the background scan completes before the rescan proceeds and files scanned during the background scan are not rescanned. Renaming a folder is treated as if the folder and the files in the folder are new. During a background scan the files in the folder are scanned first. |
— | On demand |
| Apply Templates | Downloads templates to the connected devices. | Application | Every 600 seconds |
| Attachments Cleaner | Deletes expired folders of email attachments. | Application | Daily |
| Block Health Task | |||
| Blocks Reference Count Migration | Migration of reference count to a new table. | — | One-time only on upgrade to 7.x |
| Catalog Synchronizer | |||
| Certificate and licenses update | |||
| Clear Sensitive | |||
| Cloud-DD | Tool for storage node reader/writer thread count optimization. | — | On demand |
| Containers cleaner | |||
| Copy | |||
| CSRRequestsProcessor | Listens for requests, for example between messaging servers | Ongoing | |
| Db activator and initiator | |||
| DB Backup | |||
| db-faulty-handler-task | |||
| db-updater-task | |||
| Delete | |||
| Delete conflict files | |||
| Delete from quarantine | Delete quarantined files. | On demand. | |
| Delete Infected file | Delete infected files not in quarantine. | ||
| Deleted Share Cleaner | |||
| Disconnect devices of disabled accounts | Disconnects devices of disabled users. | Application | Daily |
| Entities Version Cleaner | |||
| Expired invitations cleaner | Check for expired invitations and delete. | Main Database | Daily |
| Export folder | |||
| Folder Group Key Manager Adaptor | |||
| Frequent Contacts Cleaner | Cleans recently used contacts. | Application | Daily |
| FSCK | Runs file system check on the blocks in the system. | Main Database | On demand |
| FSCK Missing FolderGroup Cleaner | |||
| Generate Support Report | Support report generator for administrator. | Application | On demand |
| Generate user notifications | |||
| Get Mapfiles From CSV Task | |||
| Import folder | |||
| Inactive account cleaner | Does the following: * Deletes old changing mail pending requests from the database. * Deletes recover password pending requests from the database. * Deletes old inactive users and devices from the database. * Deletes old invite to register pending requests from the database. * Deletes old transient devices. * Permanently deletes already deleted devices. |
Application | Daily |
| Key Manager Monitoring | |||
| List Map File Blocks Task | |||
| Logs Cleaner | Deletes old logs. | Application | Daily |
| Match auto-assignment rule | Matches templates for devices. | Application | Daily |
| Messaging service polling task | Polling between messaging servers. | Messaging | Daily |
| Move | |||
| New | Re-enables sending emails for notifications that were already sent. | Application | Daily |
| New Stub Files Repair Task | |||
| Notification suppress cleaner | |||
| Office Online Locks Cleaner | Clean office locked files. | ||
| Orphan Scanner | Find blocks that exist in the portal but not in the storage node. | Main Database | On demand |
| Portal Notifications Background Mail Sender | Enters new notifications to a queue. | Application | Every hour. |
| Portal notifications mailing queue | |||
| Portals Trashcan Cleaner | Checks and empties a deleted portal trashcan. | Main Database | Daily |
| Process ACL Parser | |||
| Purge Storage Exceptions | Remove old storage exceptions. | ||
| Quota Changes Notifier | |||
| Replication Monitoring | |||
| Report generator | Generates users reports. | Application | Once a day and on demand. Sends the report only when needed. For each end-user once a month. |
| Rescan | |||
| Restore | |||
| Scan folder | |||
| Set ACL | |||
| Set ACLOwner | |||
| Shared as team sync Synchronizer | Fixes domains of shared resources when a sharing problem occurs writing to a database. | Main Database | Daily |
| Slave archive synchronization | |||
| Snapshot cleaner | Deletes old temporary snapshots. | Main Database | Every 30 minutes |
| Snapshot closer | Closes uncompleted snapshots and inactive snapshots open more than 2 days. | Main Database | Every 300 seconds |
| Snapshot consolidator | Consolidate snapshots to reduce the saved snapshots. | Main Database | Every hour |
| Snapshots simulator | |||
| Start Replication | |||
| Storage license quota | |||
| Storage Node cleaner | Cleans deleted blocks from storage nodes. | Main Database | Every 60 seconds |
| Storage node migration | |||
| Storage Usage Calculator | Recalculates storage usage for each user and portal. | Application | Daily |
| Storage Usage Cleaner | Deletes records from the storage usage table for old users and portals (not the actual data). | Application | Daily |
| Syslog starting flow monitoring | Monitors the status of the Edge Filer Syslog service starting up | Application | On request |
| Syslog Connector Status Monitor | Monitors the status of the Edge Filer Syslog service status | Application | On request |
| Table Index maintenance | |||
| Table sizes monitor | Trace for table size. | ||
| Task update antivirus status | Antivirus monitor status. | ||
| Undelete | Restore deleted files in retention range. | On demand | |
| Unquarantine | Remove files from quarantine. | On demand | |
| Unused block cleaner | Deletes unused blocks. | Main Database | Every 60 seconds |
| Unused mapfile block cleaner | |||
| Update accounts | Updates users and groups from active directory, including deleting and adding users. Updates also user plans if needed. | Application | Daily |
| Update storage status | Monitors and updates storage status. | ||
| Verify files | |||
| Zones Synchronizer | Updates zones according to recent changes. |
Status
You can view the current status of servers.
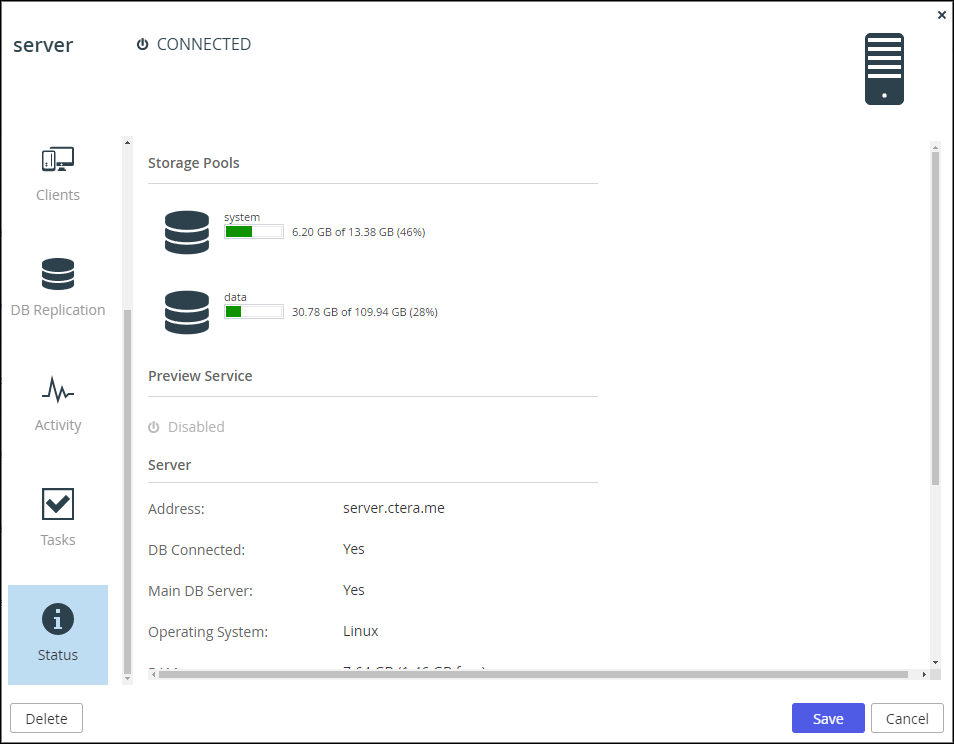
In the Status option, you can view the following:
- Load Average – The server's average load over time. A server's load is the number of currently running processes that are using, or waiting to use, the CPU.
The following information is available. - Storage Pools – The status and amount of free storage on each server storage pool.
- Preview Service – Disabled if not a document preview server. For a server configured as document preview server, the status of the preview service. Click Restart to restart the preview server.
- Server – Details about the server:
- Address – The server's domain name.
- DB Connected – Whether the DB is connected to the CTERA Portal application.
- Main DB Server – Whether the server is the main DB server.
- Operating System – The server's operating system.
- RAM – The server's RAM and the amount of free RAM.
- Number of CPUs – The number of CPUs.
- Portal Version – The CTERA Portal version.
- Platform – The platform on which the CTERA Portal is installed.
- Image Version – The version number of the server image.
- Uptime – The time that the server has been up.
- Tomcat Uptime – The time that the Tomcat application server has been up.