The following requirements are needed for CTERA Sentinel:
- CTERA Edge Filer 7.8.x or higher and CTERA Portal 8.2.x.
- A Syslog server with Azure Arc and Azure Monitoring Agent installed.
- A resource group in Microsoft Azure.
- A log analytics workspace in Microsoft Sentinel.
Setting Up Microsoft Sentinel for CTERA Sentinel
To set up Microsoft Sentinel for CTERA Sentinel, you need a resource group and a Log Analytics Workspace in Microsoft Sentinel.
To create a resource group in Microsoft Azure:
- In Microsoft Azure, access the Resource groups service.
- Click Create and complete the fields as follows:
Subscription – The Microsoft Azure subscription.
Resource group – A unique name for the resource group.
Region – Select a region to host the resource group. - Click Review + create, and after the group is validated, click Create.
The Resource group is created.
To create and add a Log Analytics Workspace in Microsoft Sentinel:
- In Microsoft Azure, access the Microsoft Sentinel service.
The Microsoft Sentinel screen is displayed.
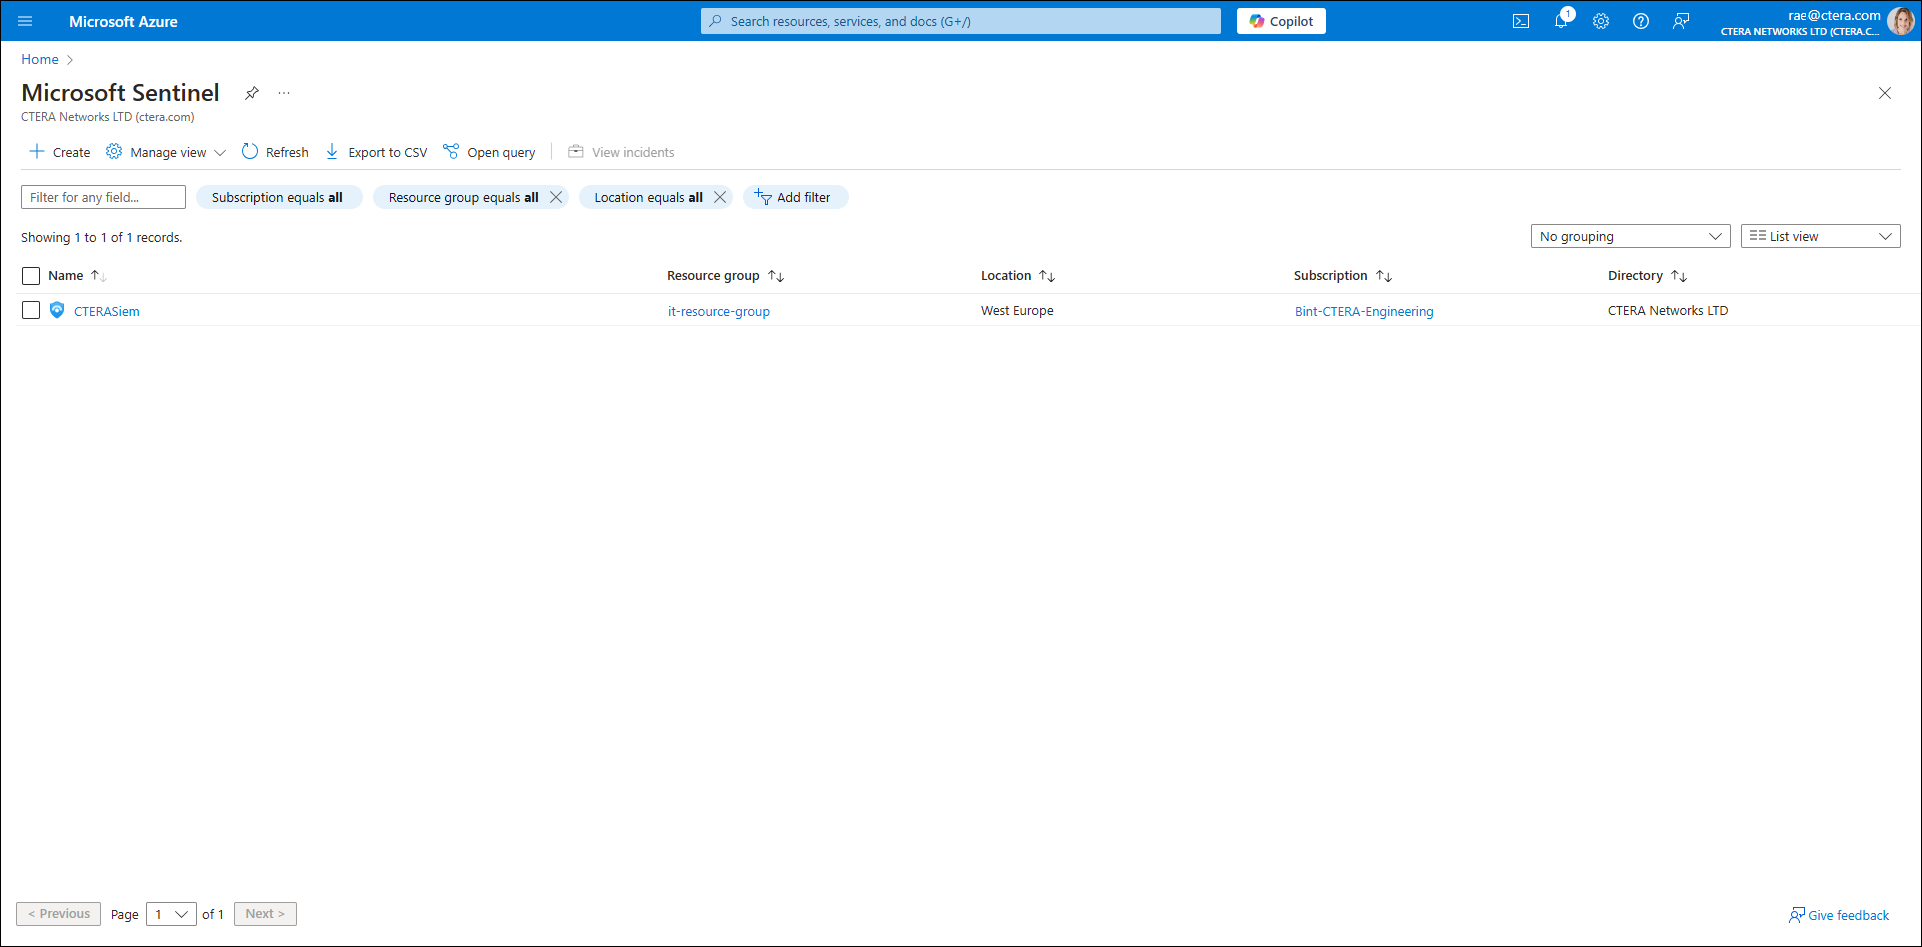
- Click Create.
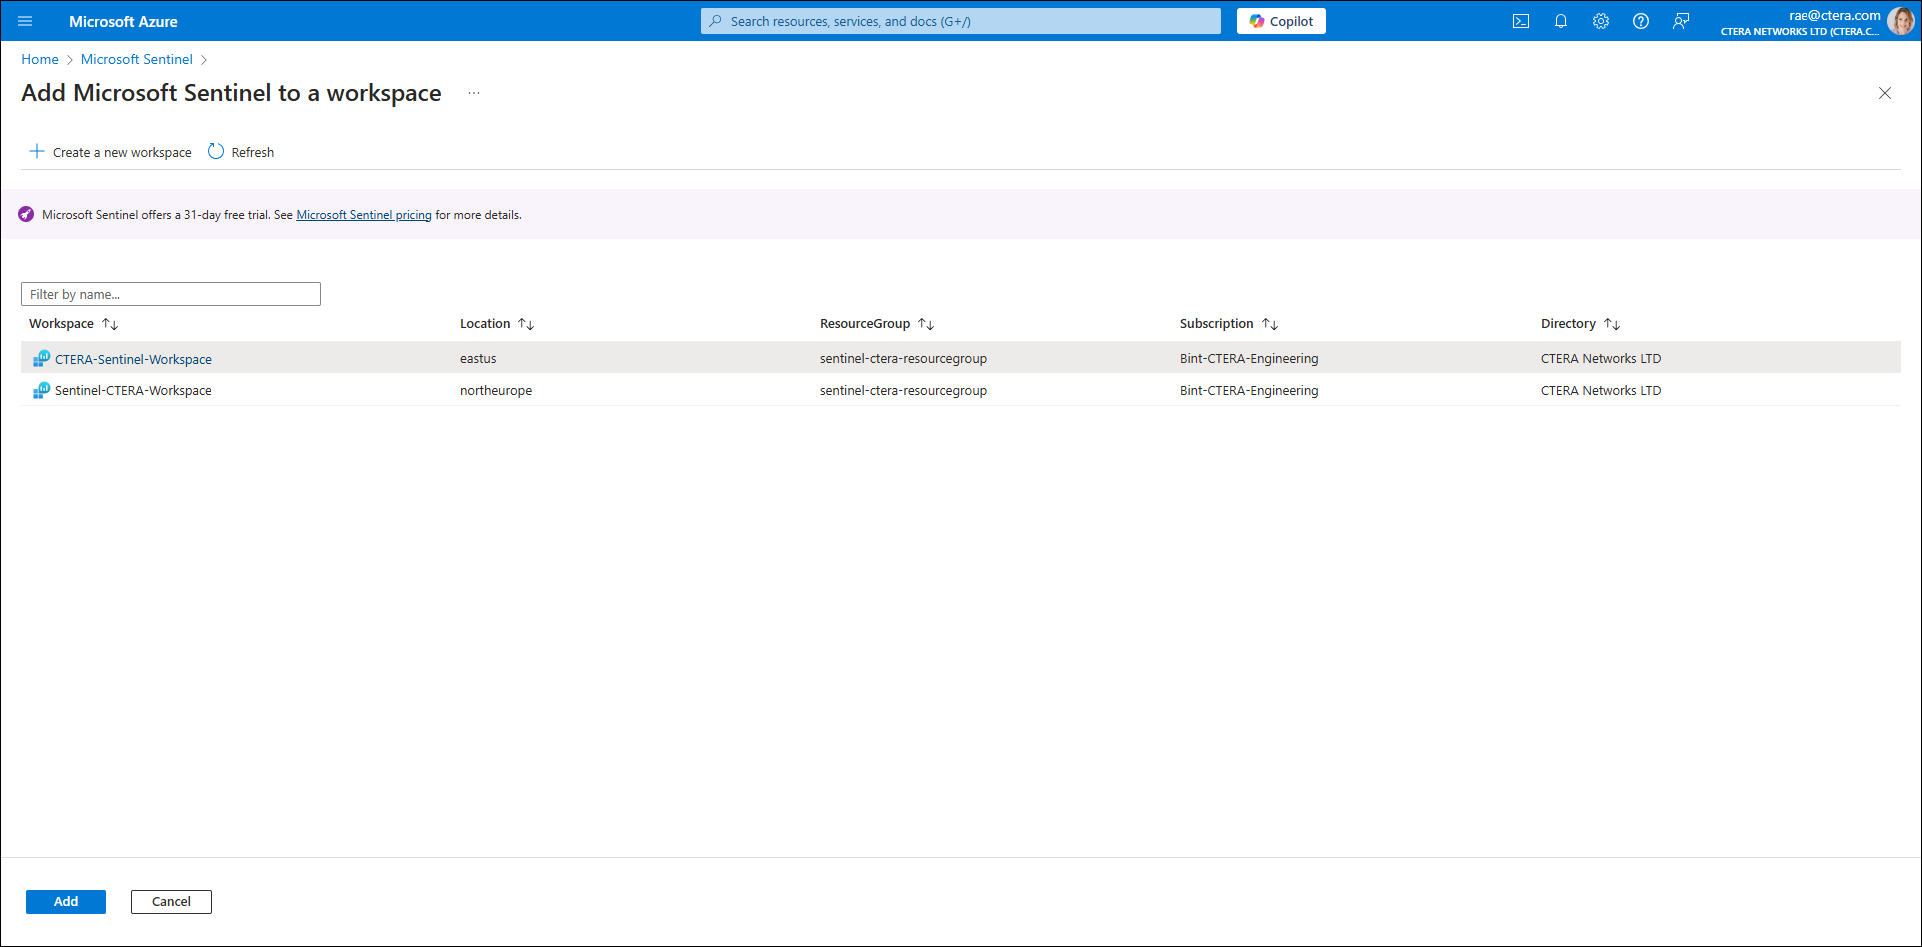
The Add Microsoft Sentinel to a workspace screen is displayed.
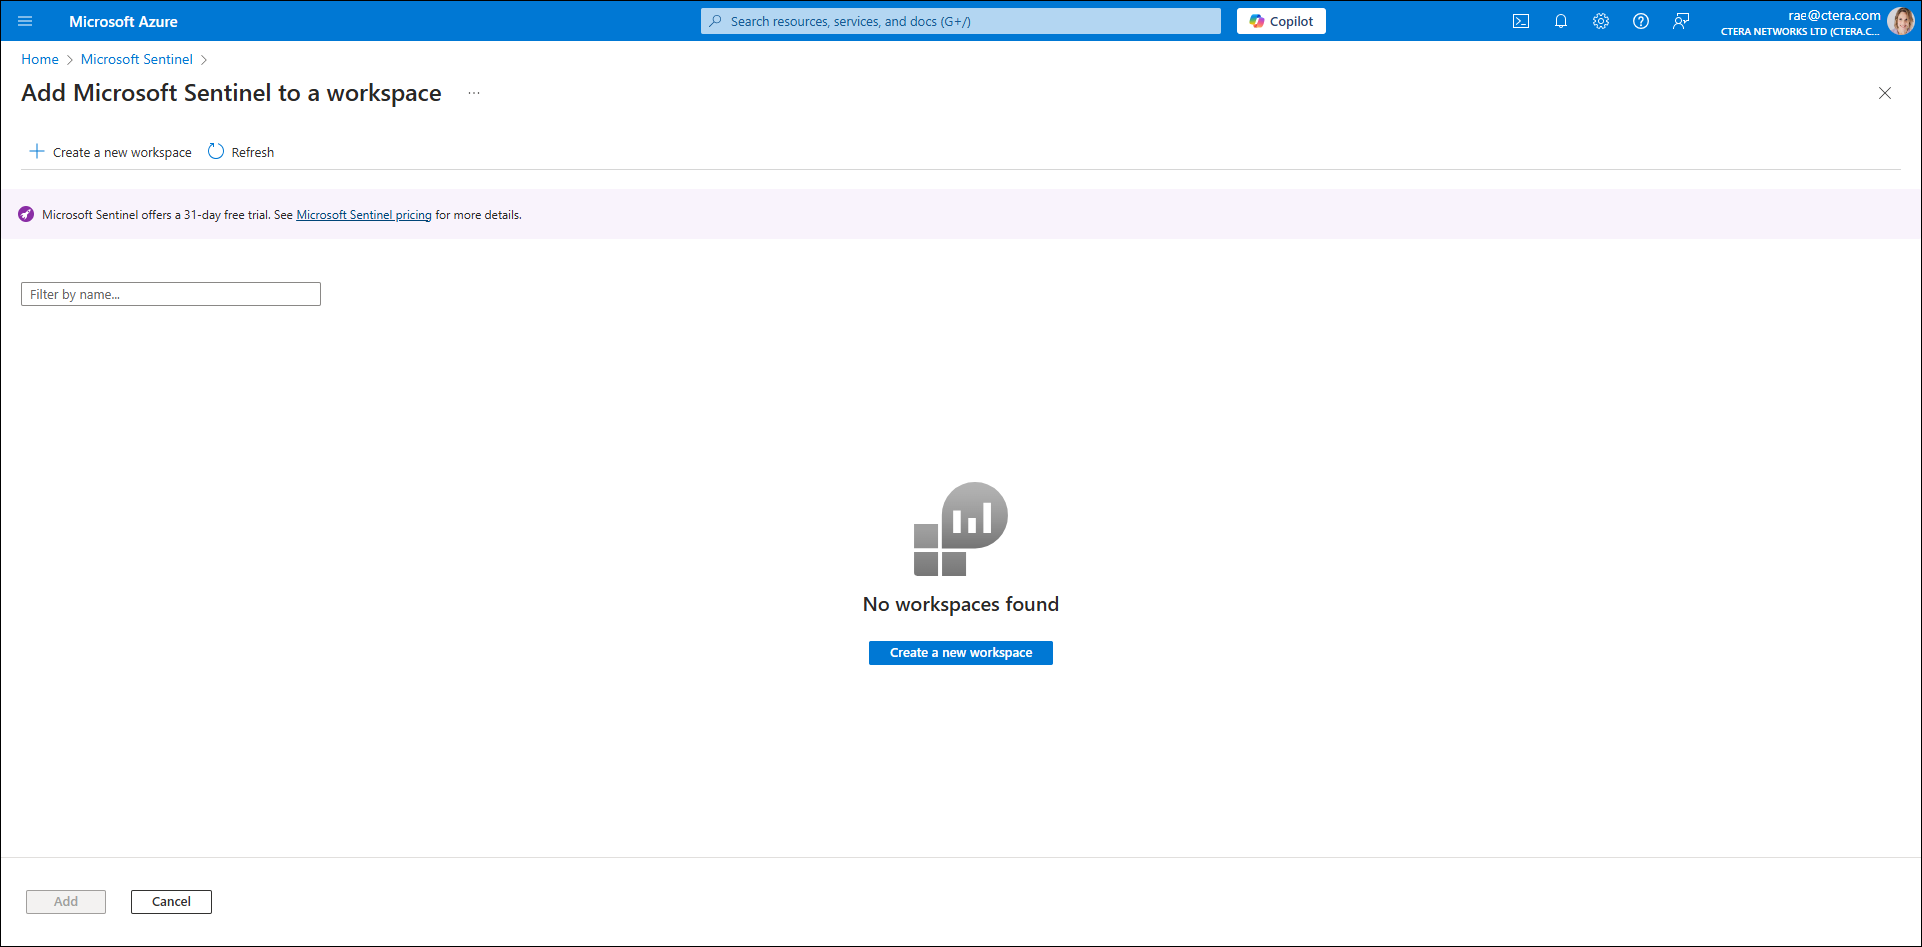
- Click Create a new workspace.
The Create Log Analytics workspace screen is displayed.
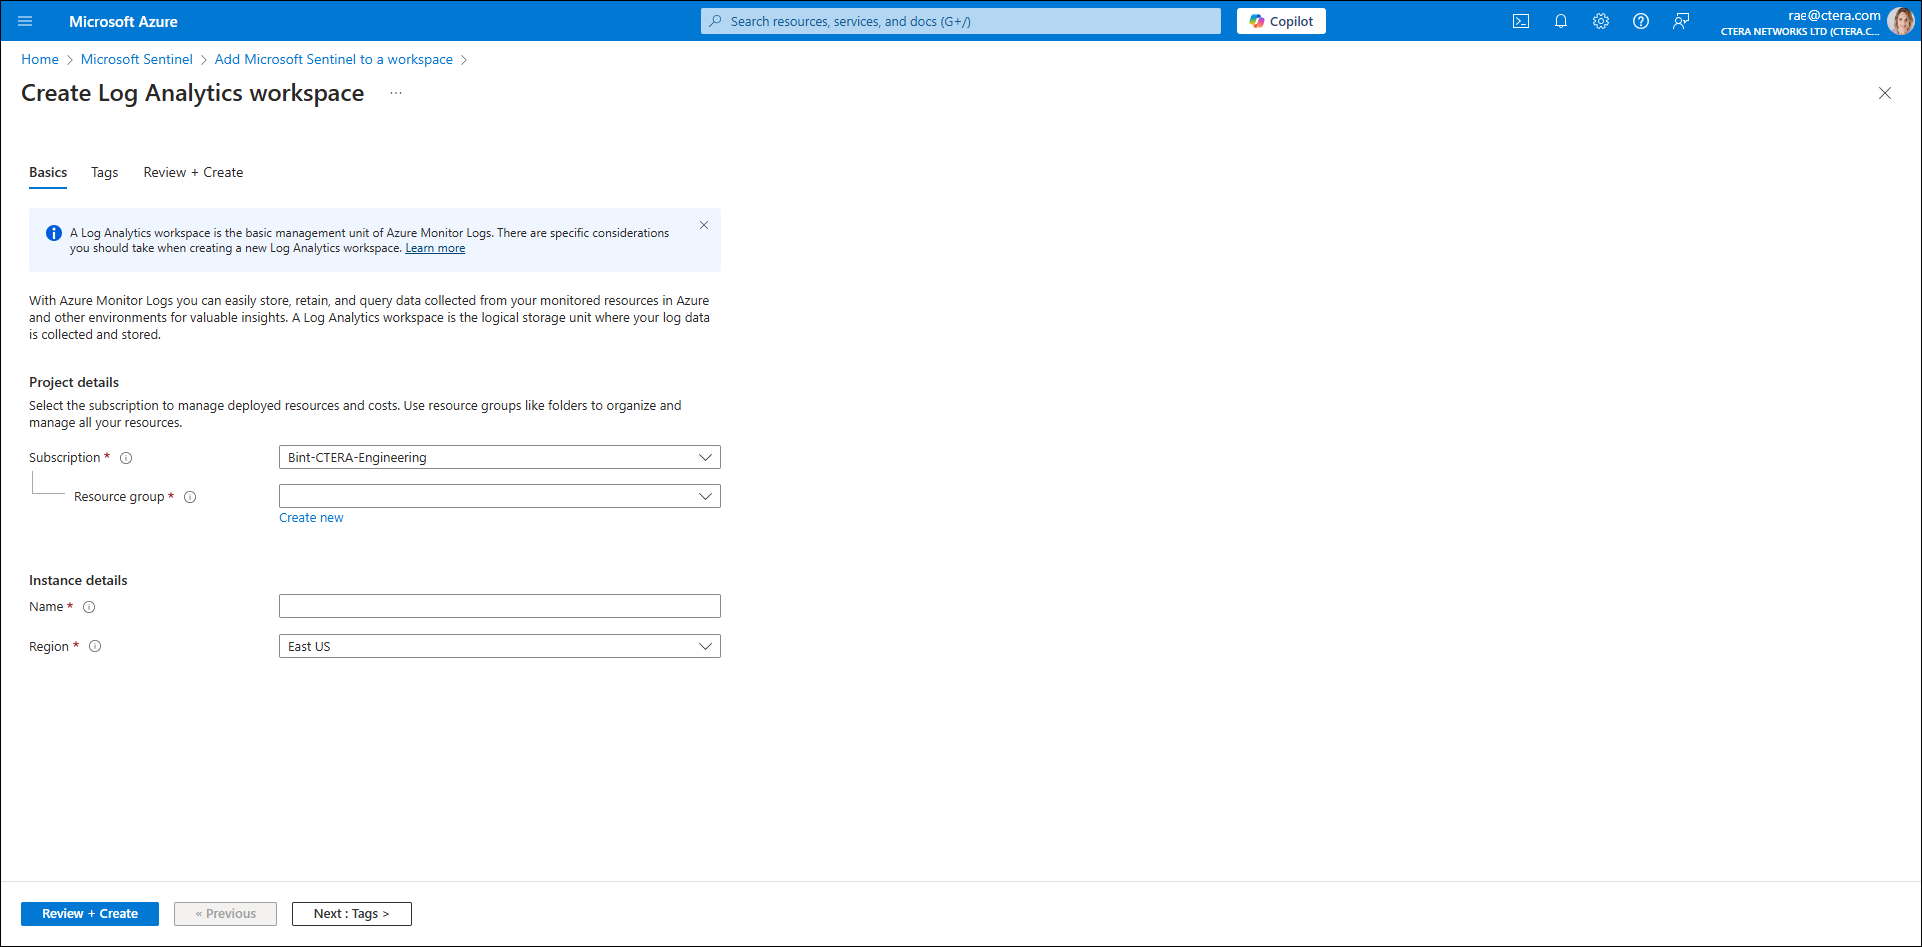
- Complete the fields as follows:
Subscription – The Microsoft Azure subscription.
Resource group – Select the resource group.
Name – A unique name for the workspace.
Region – The resource group to host the workspace. - Click Review + create, and after the workspace is validated, click Create.
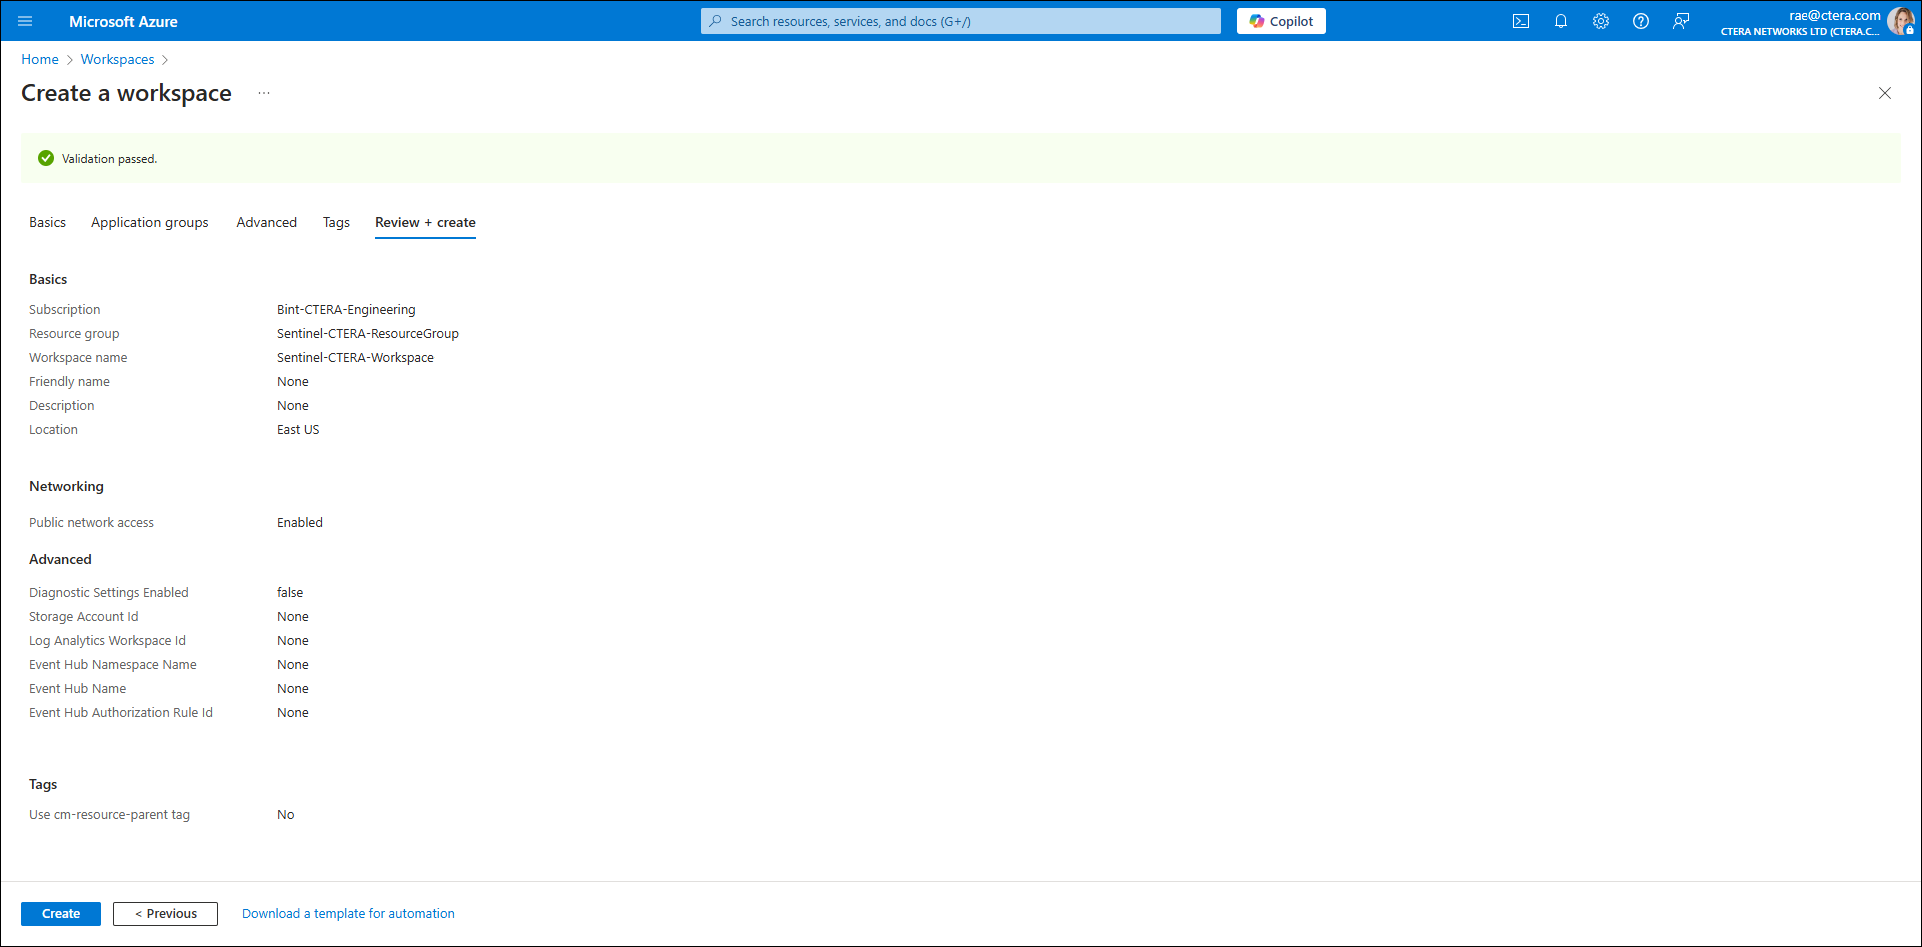
- When the deployment is complete, re-access Microsoft Sentinel.
- Click Create.
- Select the newly created workspace and click Add.
You’ve now set up the Microsoft Sentinel environment for CTERA Sentinel.
Installing CTERA Sentinel
Before installing CTERA Sentinel, you must connect the Syslog server to Azure Arc and install and connect the Azure Monitor Agent (AMA).
To connect the Syslog server to Azure Arc:
- In Microsoft Azure, access the Azure Arc service.
- Under Azure Arc resources, click Machines, then Add/Create.
- Select Add a Machine.
Add Servers with Azure Arc is displayed.
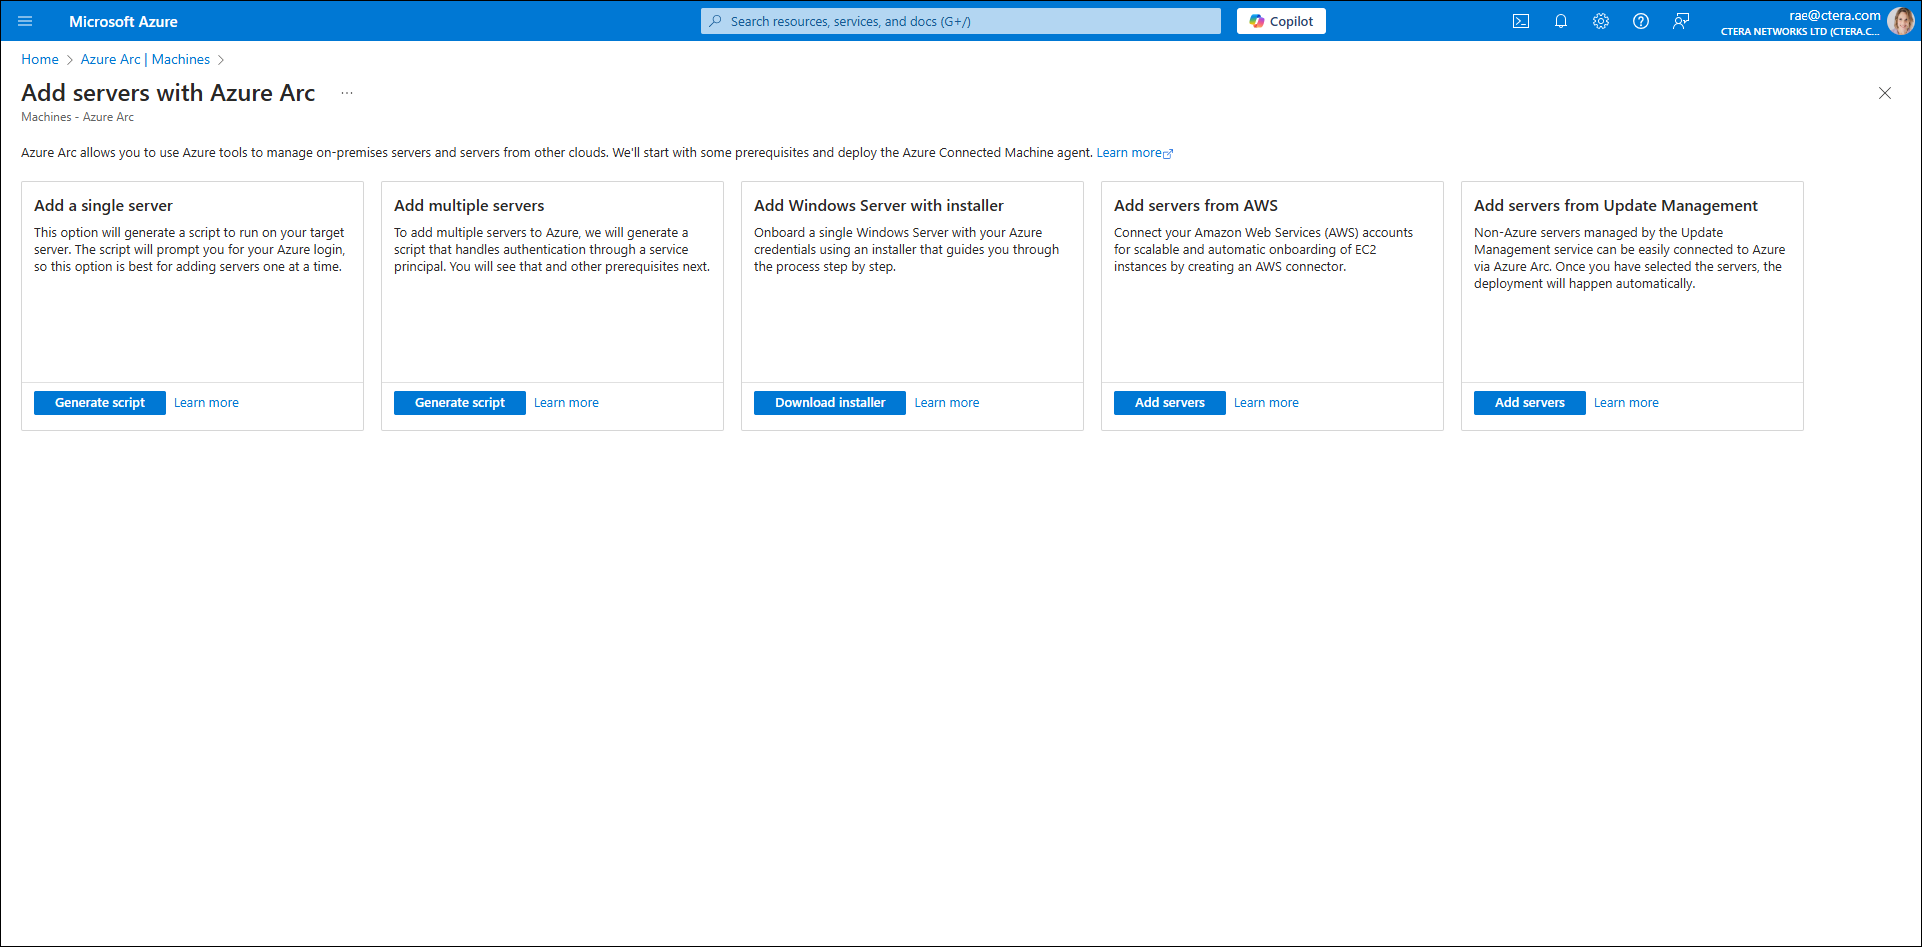
- Select Add a single server and then click Generate Script.
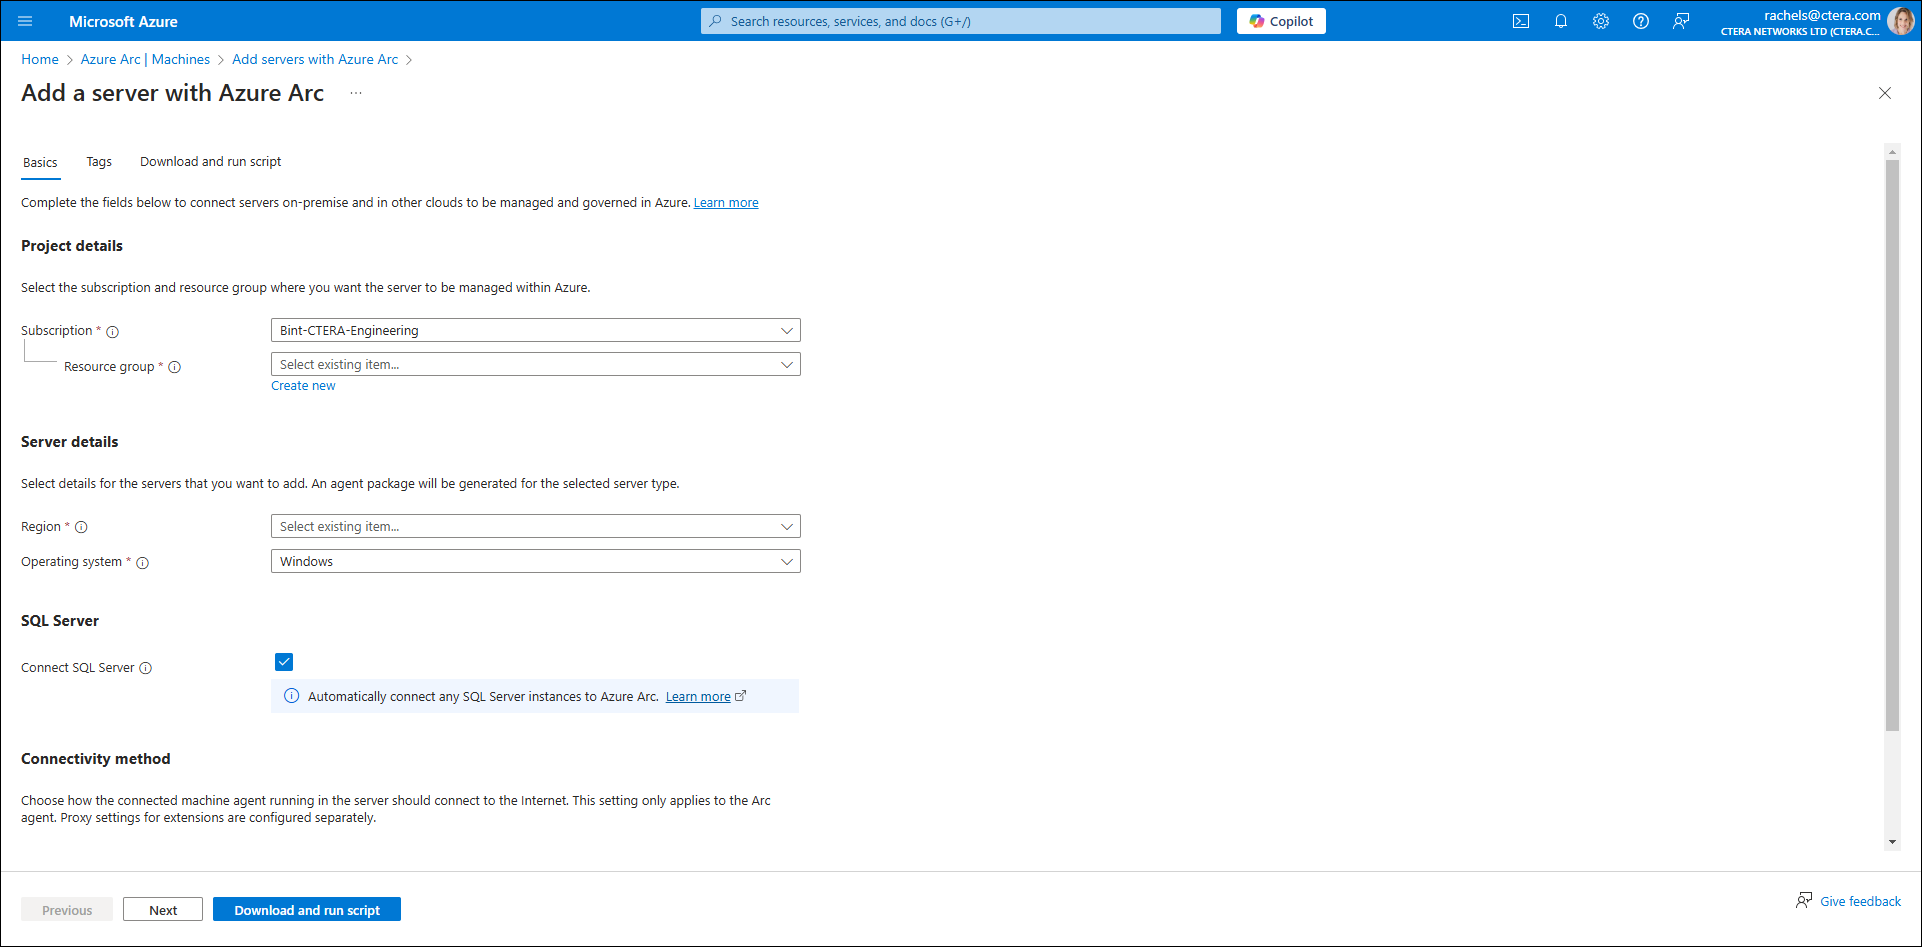
- Complete the fields as follows:
Subscription – The Microsoft Azure subscription.
Resource group – Select the resource group.
Region – Select the region. - Click Download and run script.
A script is generated.
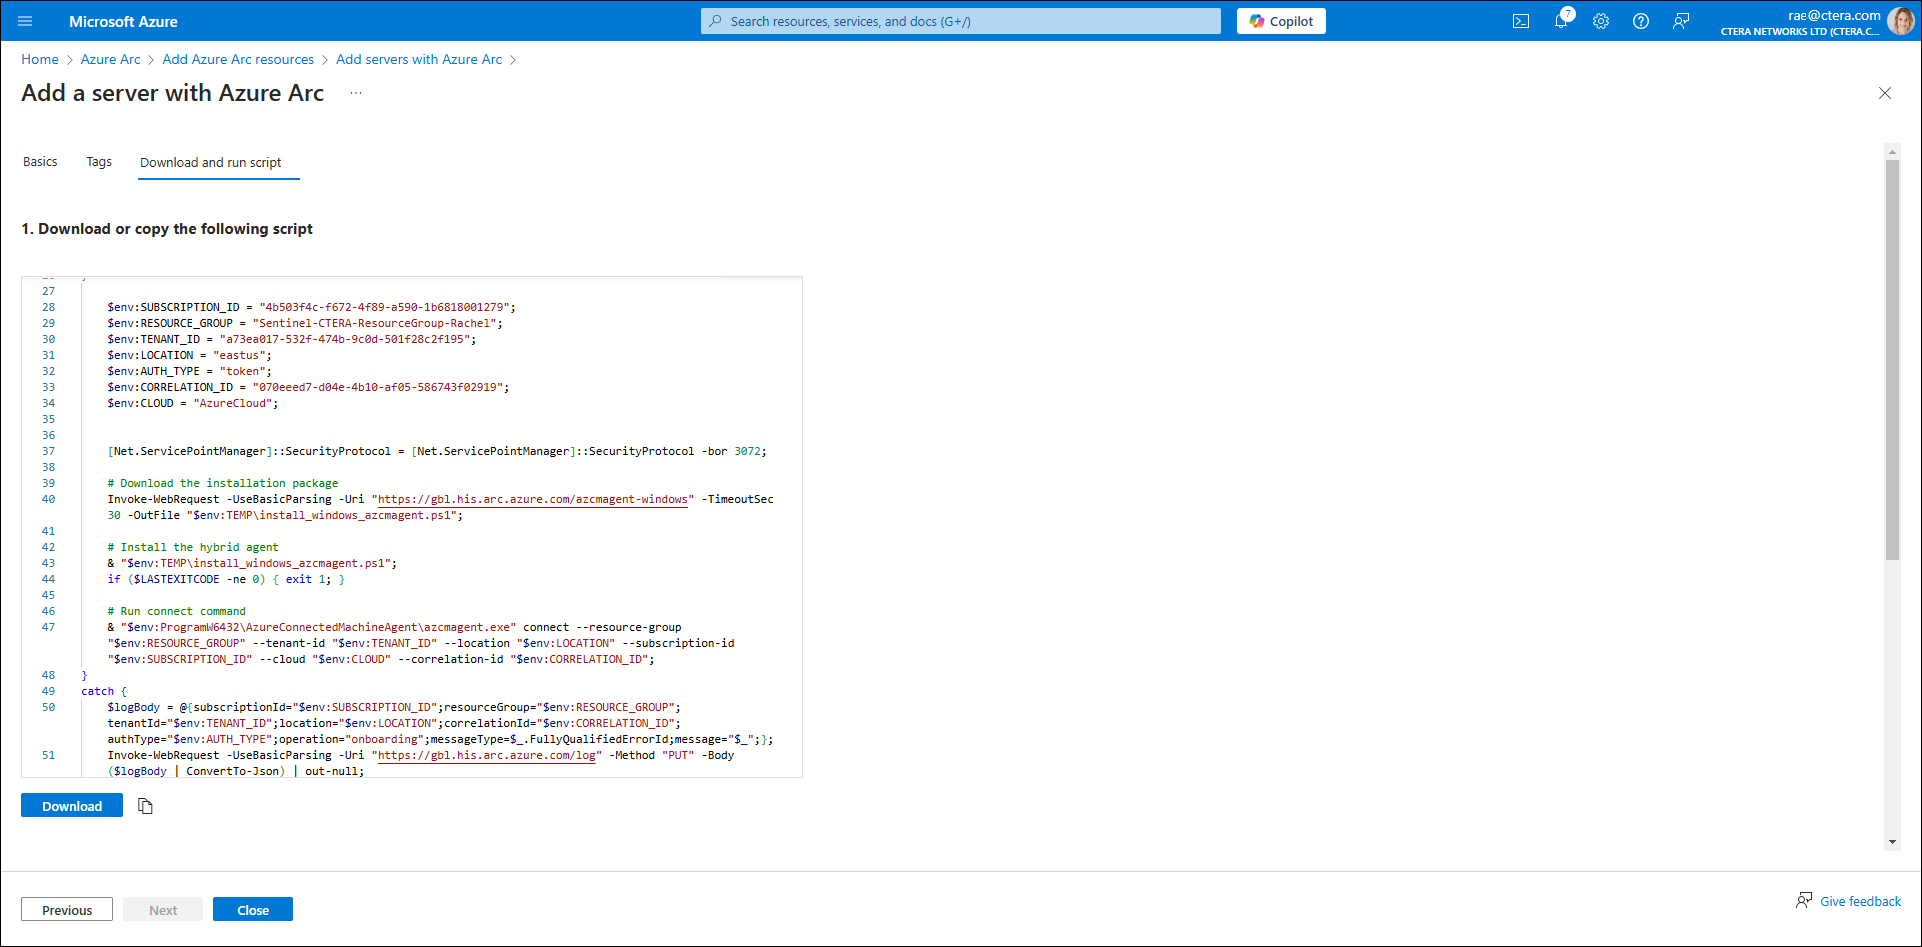
- Copy this script to the Syslog server.
- Run the script on the Syslog server, which will automatically connect the server to Azure Arc.
- Download and install Azure Monitor Agent (AMA) on the Syslog server.
You can use the following URL to download AMA: https://raw.githubusercontent.com/Azure/Azure-Sentinel/master/DataConnectors/Syslog/ForwarderAMAinstaller.py.
Create a Data Collection Rule to collect platform metrics before CTERA Sentinel can be used.
To create a Data collection rule:
- In Microsoft Azure, navigate to Data collection rules.
- Click Create.
A Create Data Collection Rule screen is displayed.
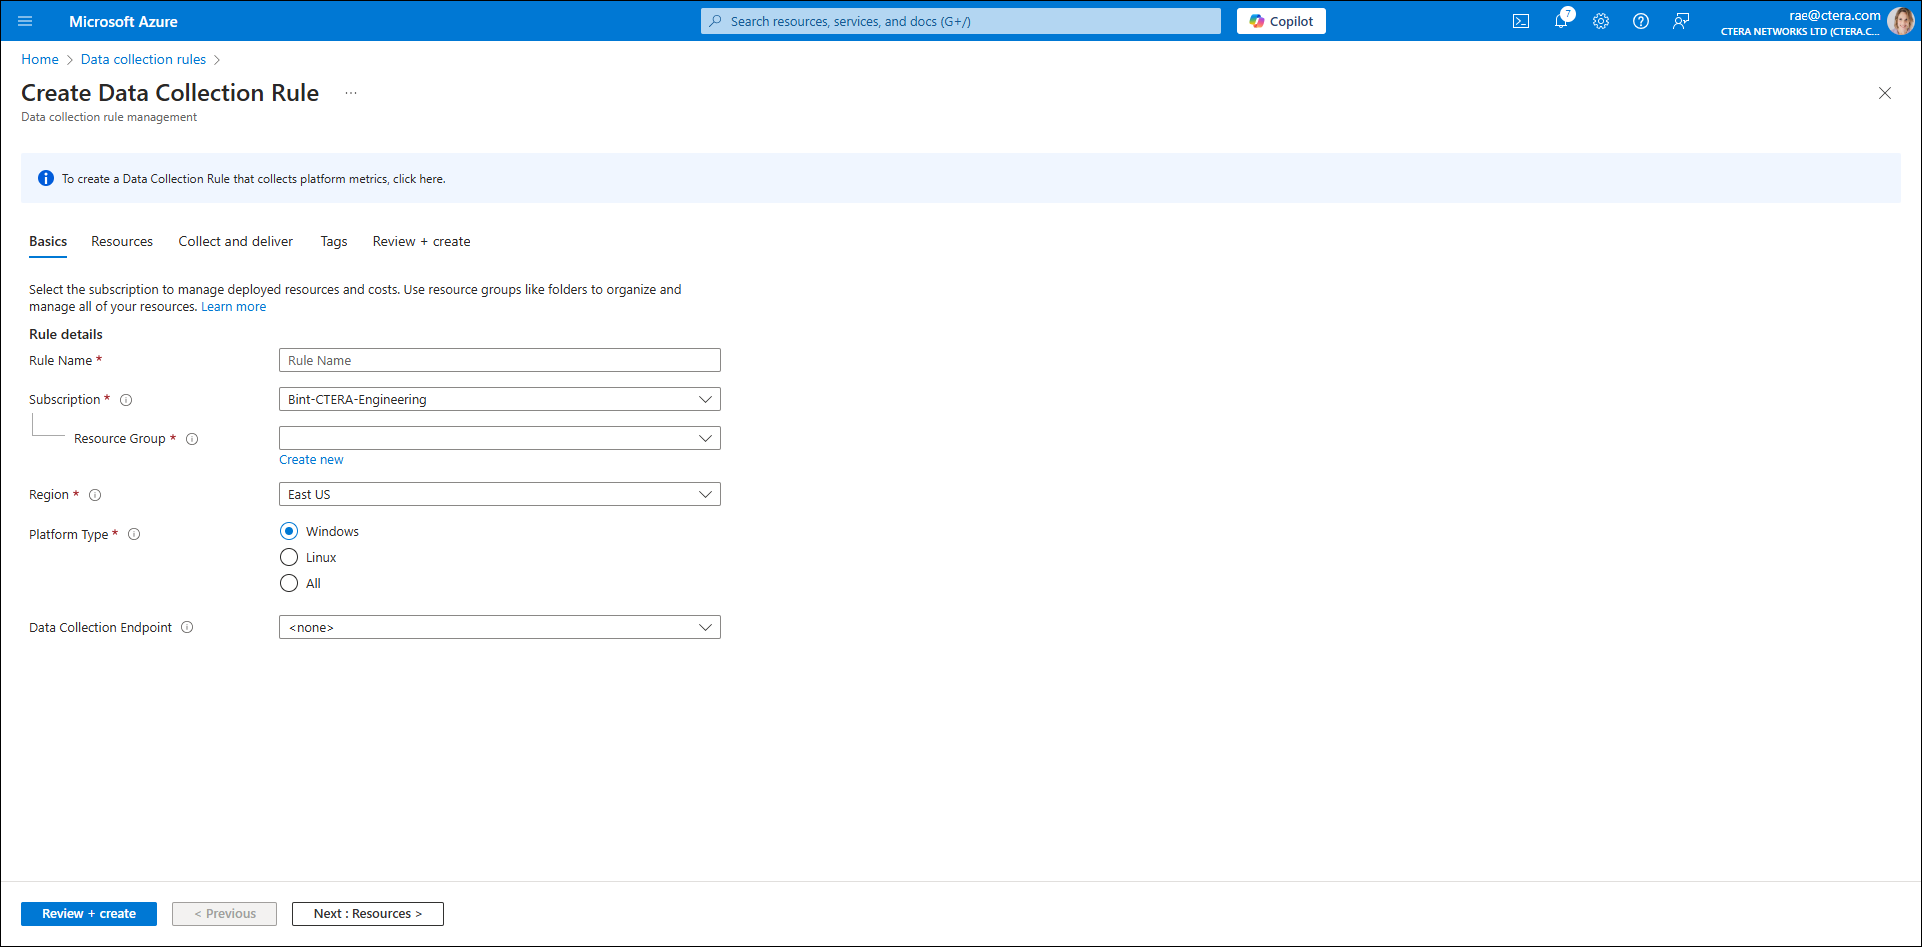
- Complete the fields as follows:
Rule name – Create a unique rule name.
Subscription – The Microsoft Azure subscription.
Resource group – Select the resource group.
Region – Select the region.
Platform Type – Select Linux.
Data Collection Endpoint – Keep thenonedefault. - Click Next: Resources.
The screen displayed enables you to pick a set of resources to collect data from. - Click Add resources.
The Select a scope blade is displayed.
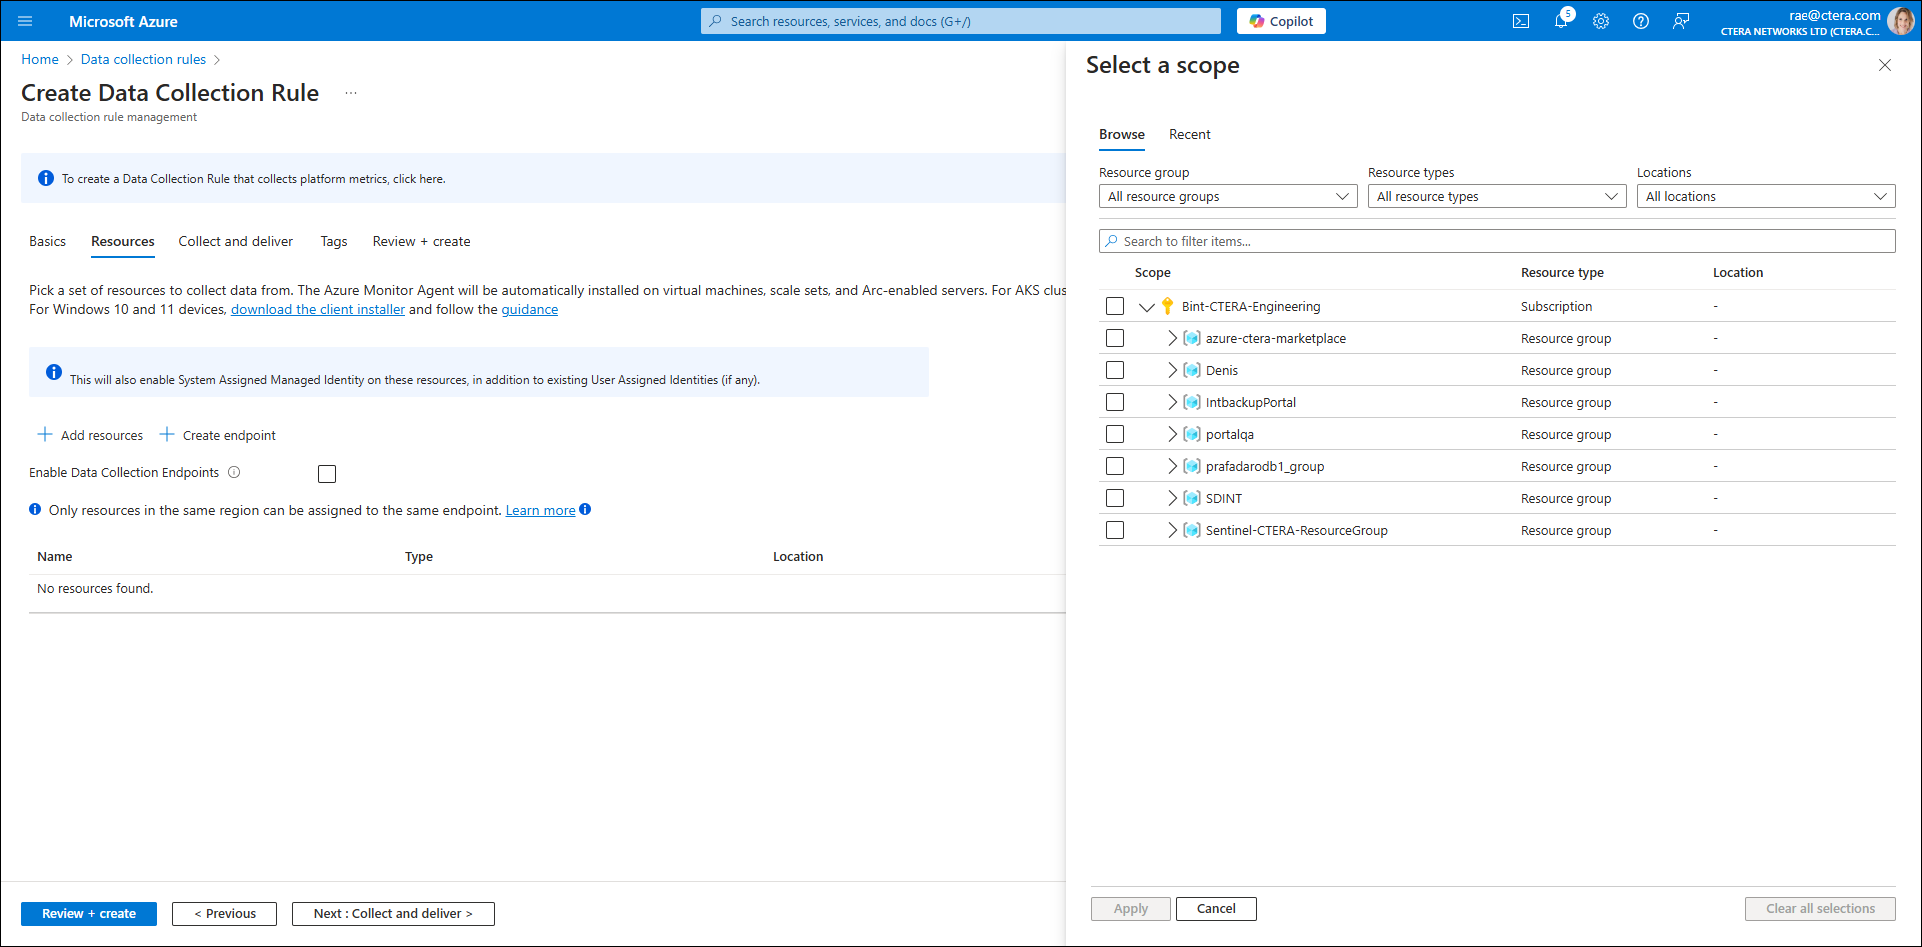
- Complete the fields as follows:
Resource group – Select the resource group from the Scope drop-down list and expand the arrow to the left of the resource group's name. The resource type is displayed.
Resource type– Select Machine - Azure Arc.
Location – Use the default region.
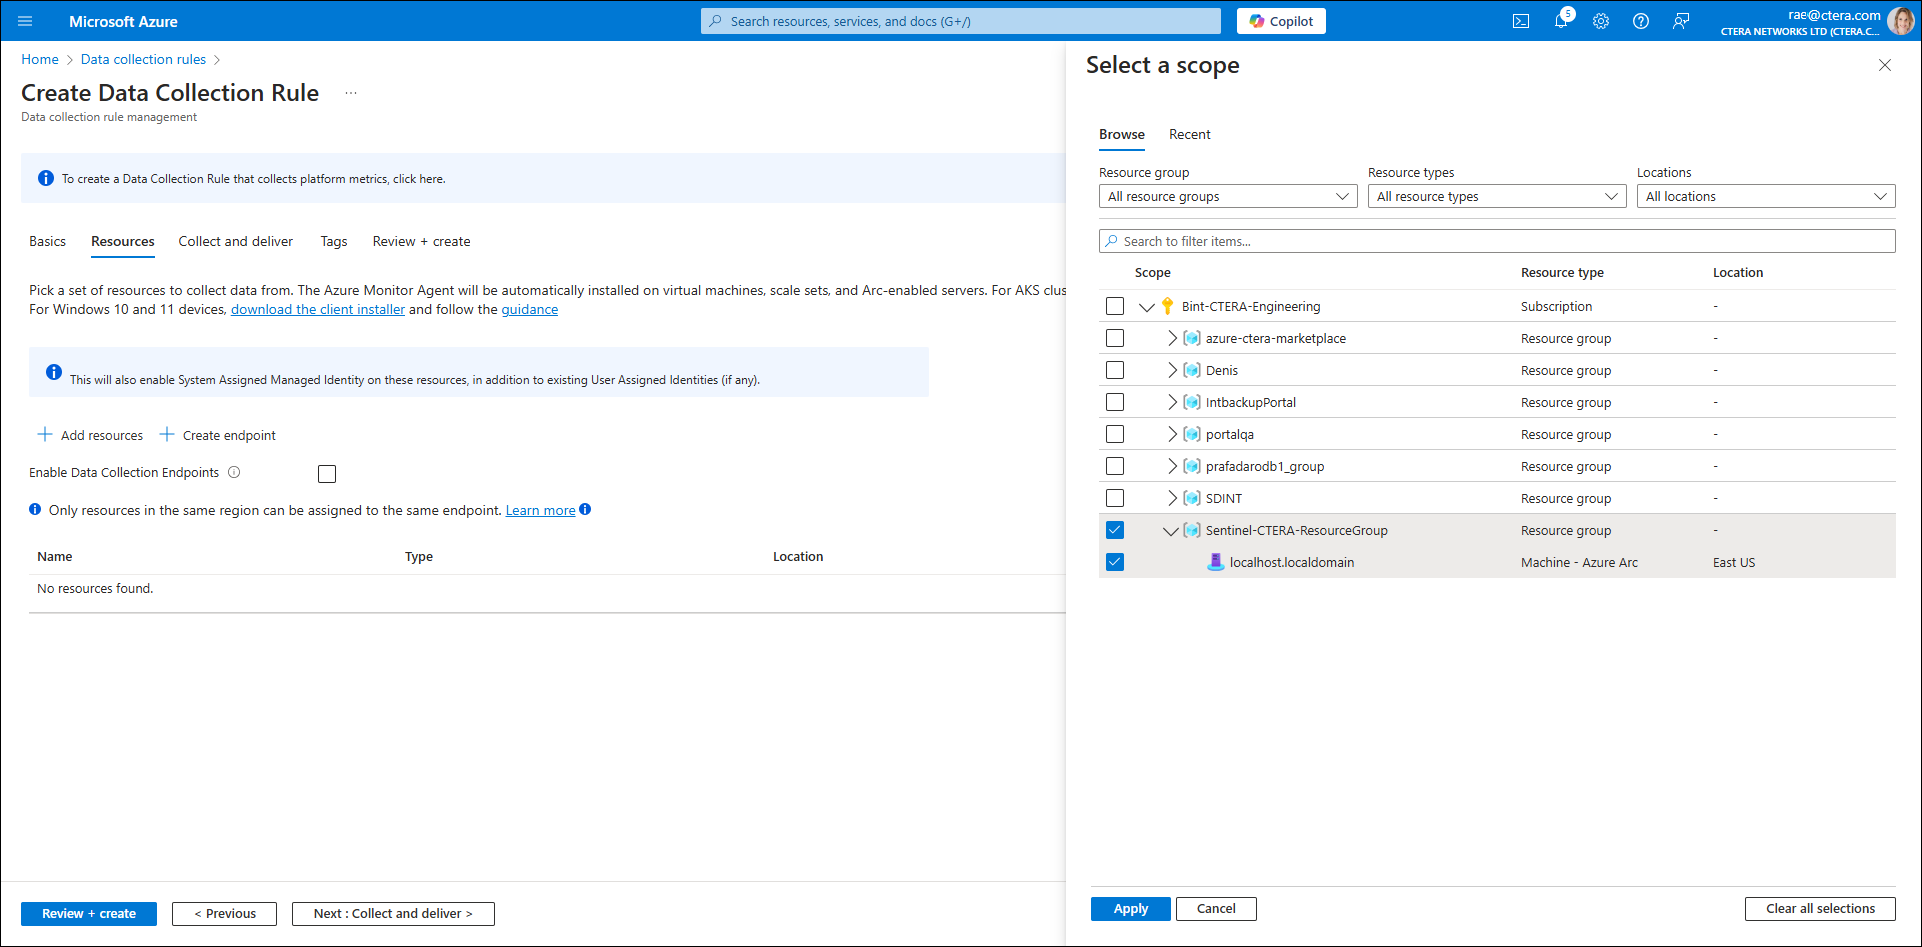
- Click Apply.
The Add data source blade is displayed. - Click Add data source.
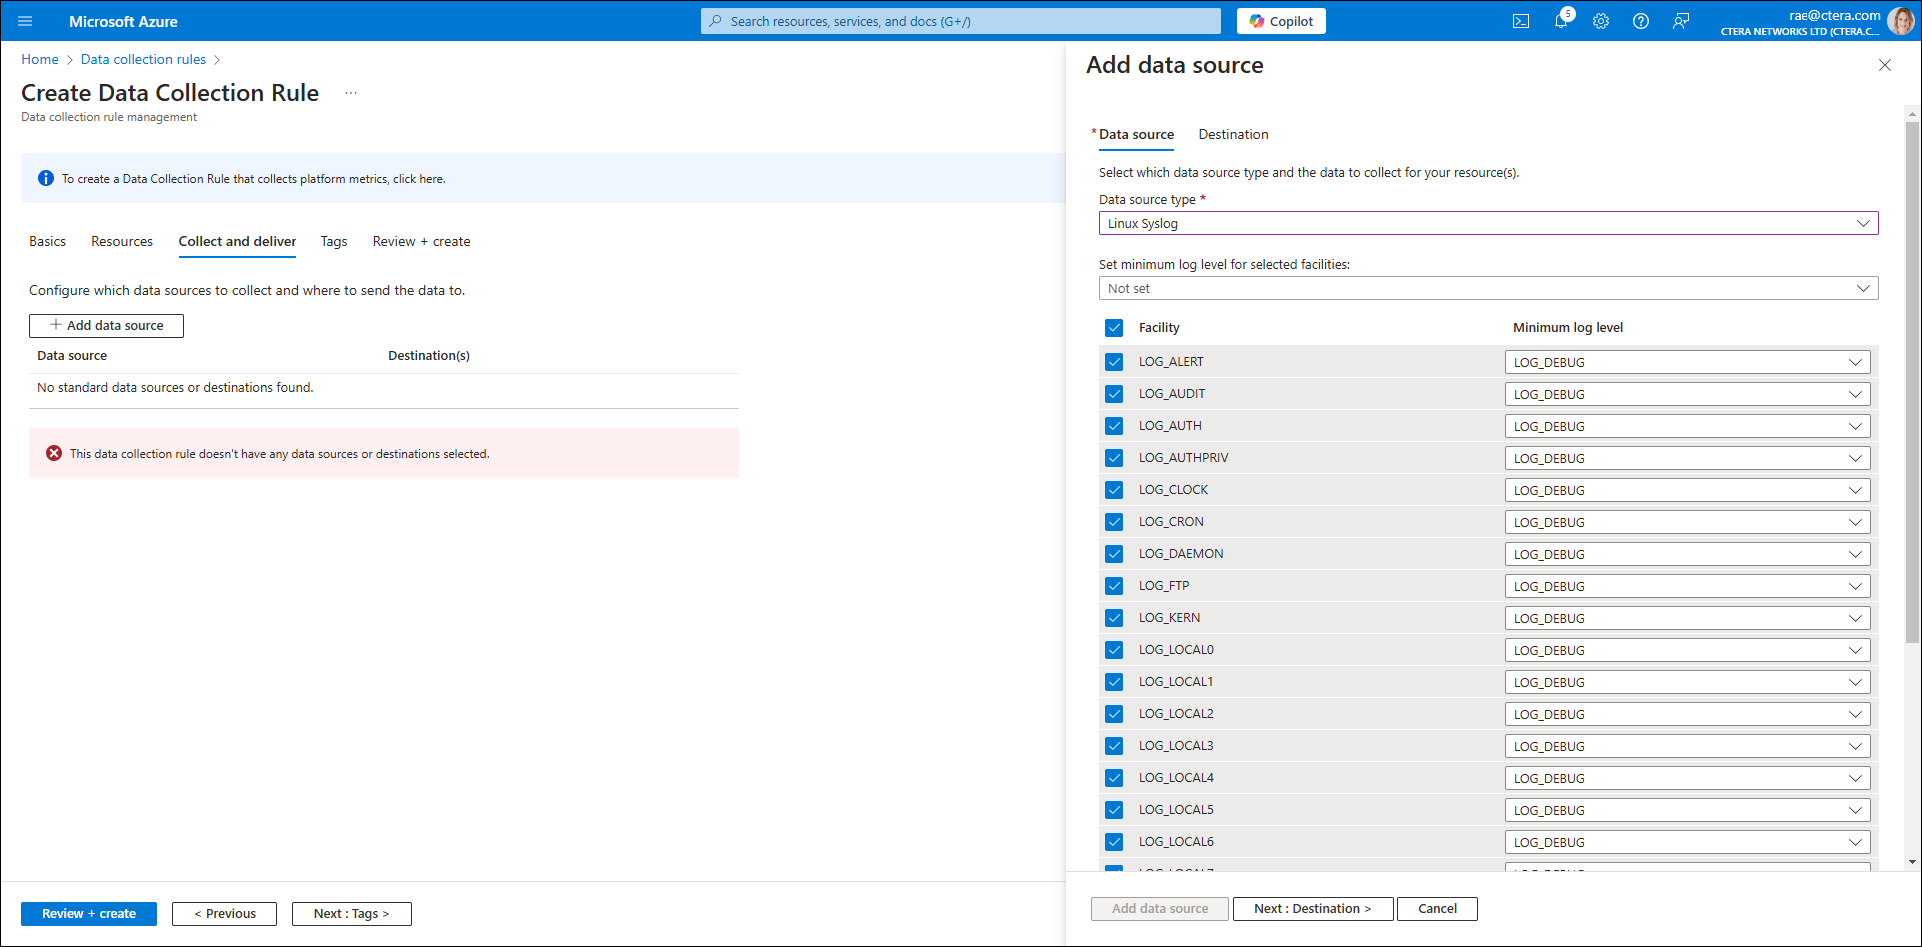
- Check the Facility box to select all facilities.
- Click Next: destination.
The Add destination blade is displayed.
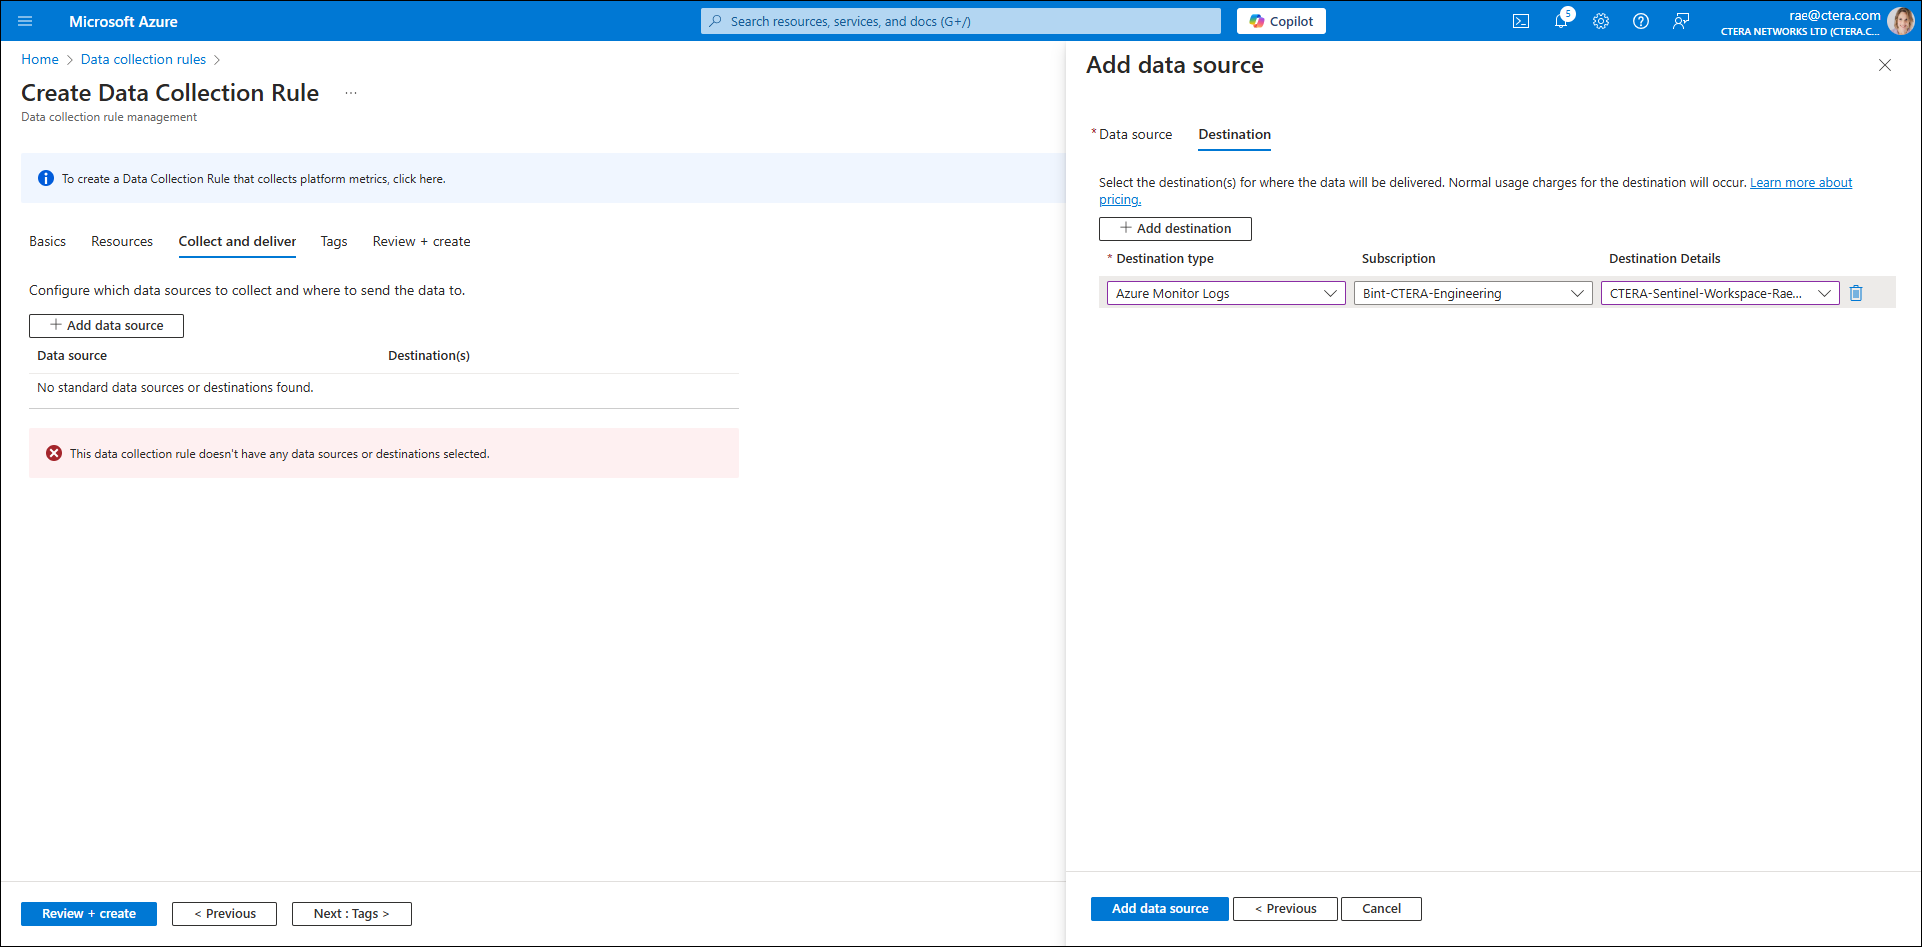
- Click Add destination and complete the fields as follows:
Destination type – Select Azure Monitor Logs from the drop-down menu.
Subscription – The Microsoft Azure subscription.
Destination Details – Select the workspace. - Click Add data source.Note
Adding Tags is optional.
- Click Review + create.
Once validated, the Data Collection Rule is ready to be created.
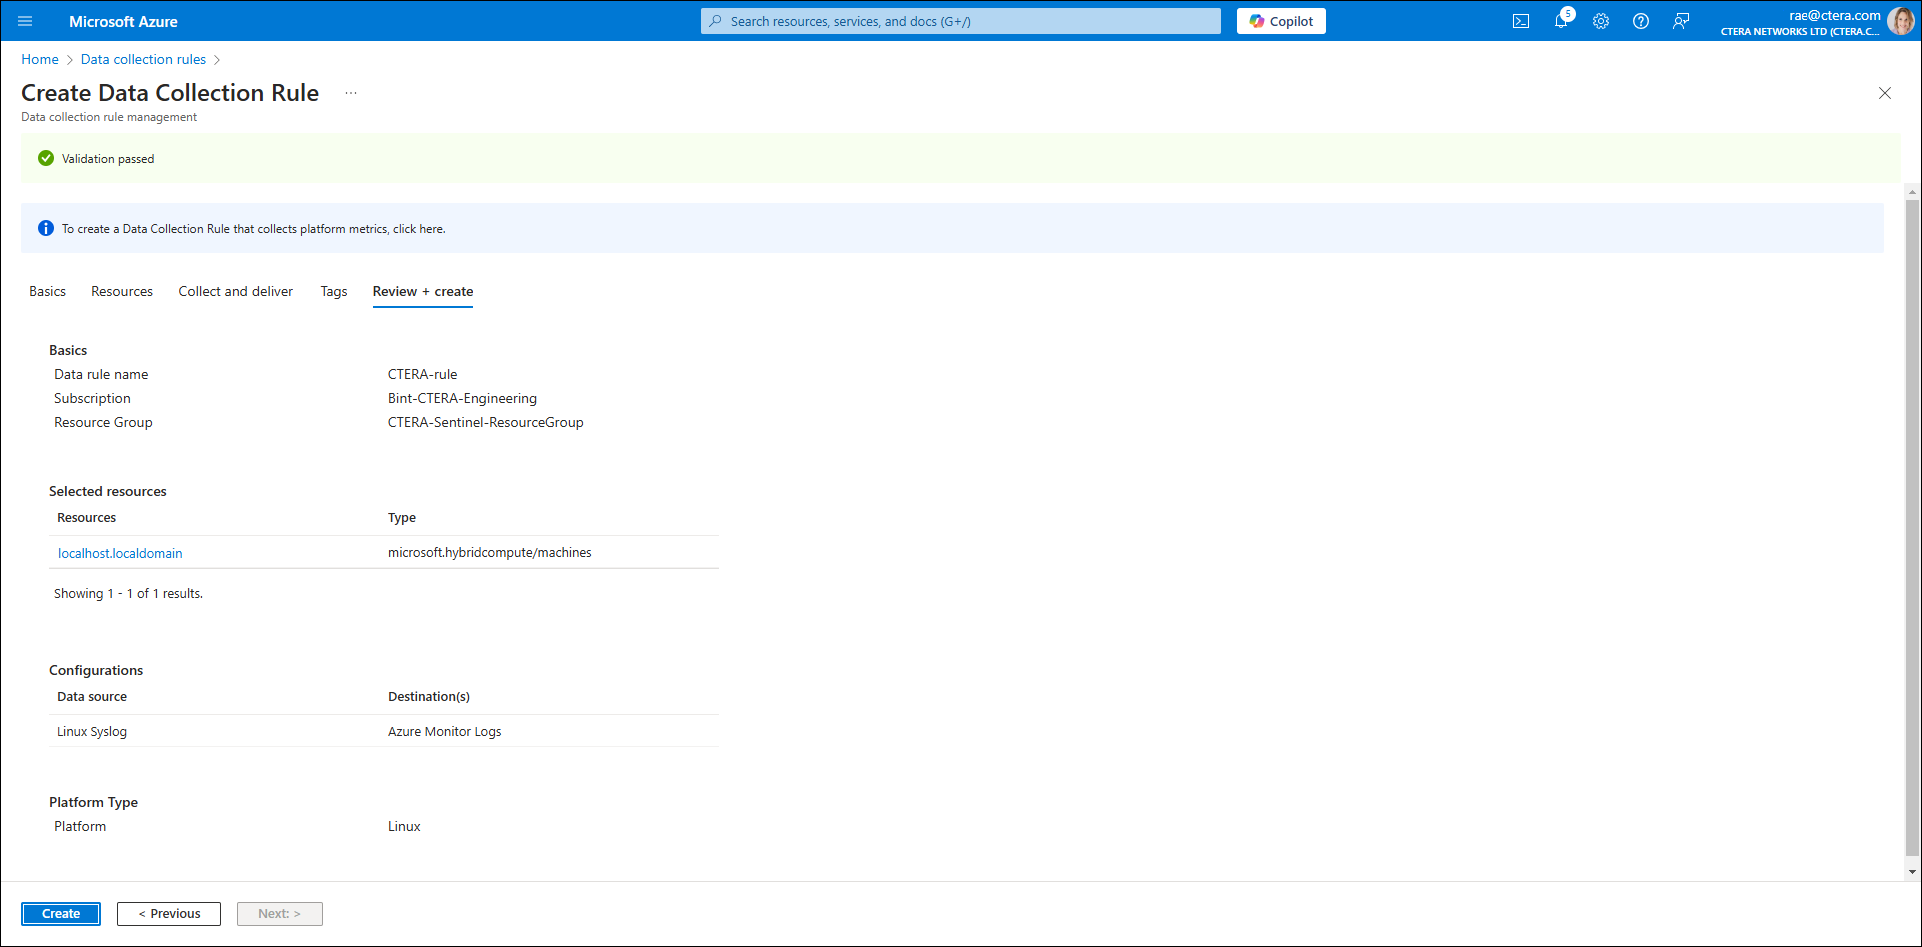
- Click Create.
Once deployment is complete, the Data Collection Rule is created.
CTERA Sentinel is ready to be installed.
To install CTERA Sentinel:
- In Microsoft Azure, access the Microsoft Sentinel service.
- Select the required Log Analytics Workspace.
- Select Content Hub under Content management in the menu.
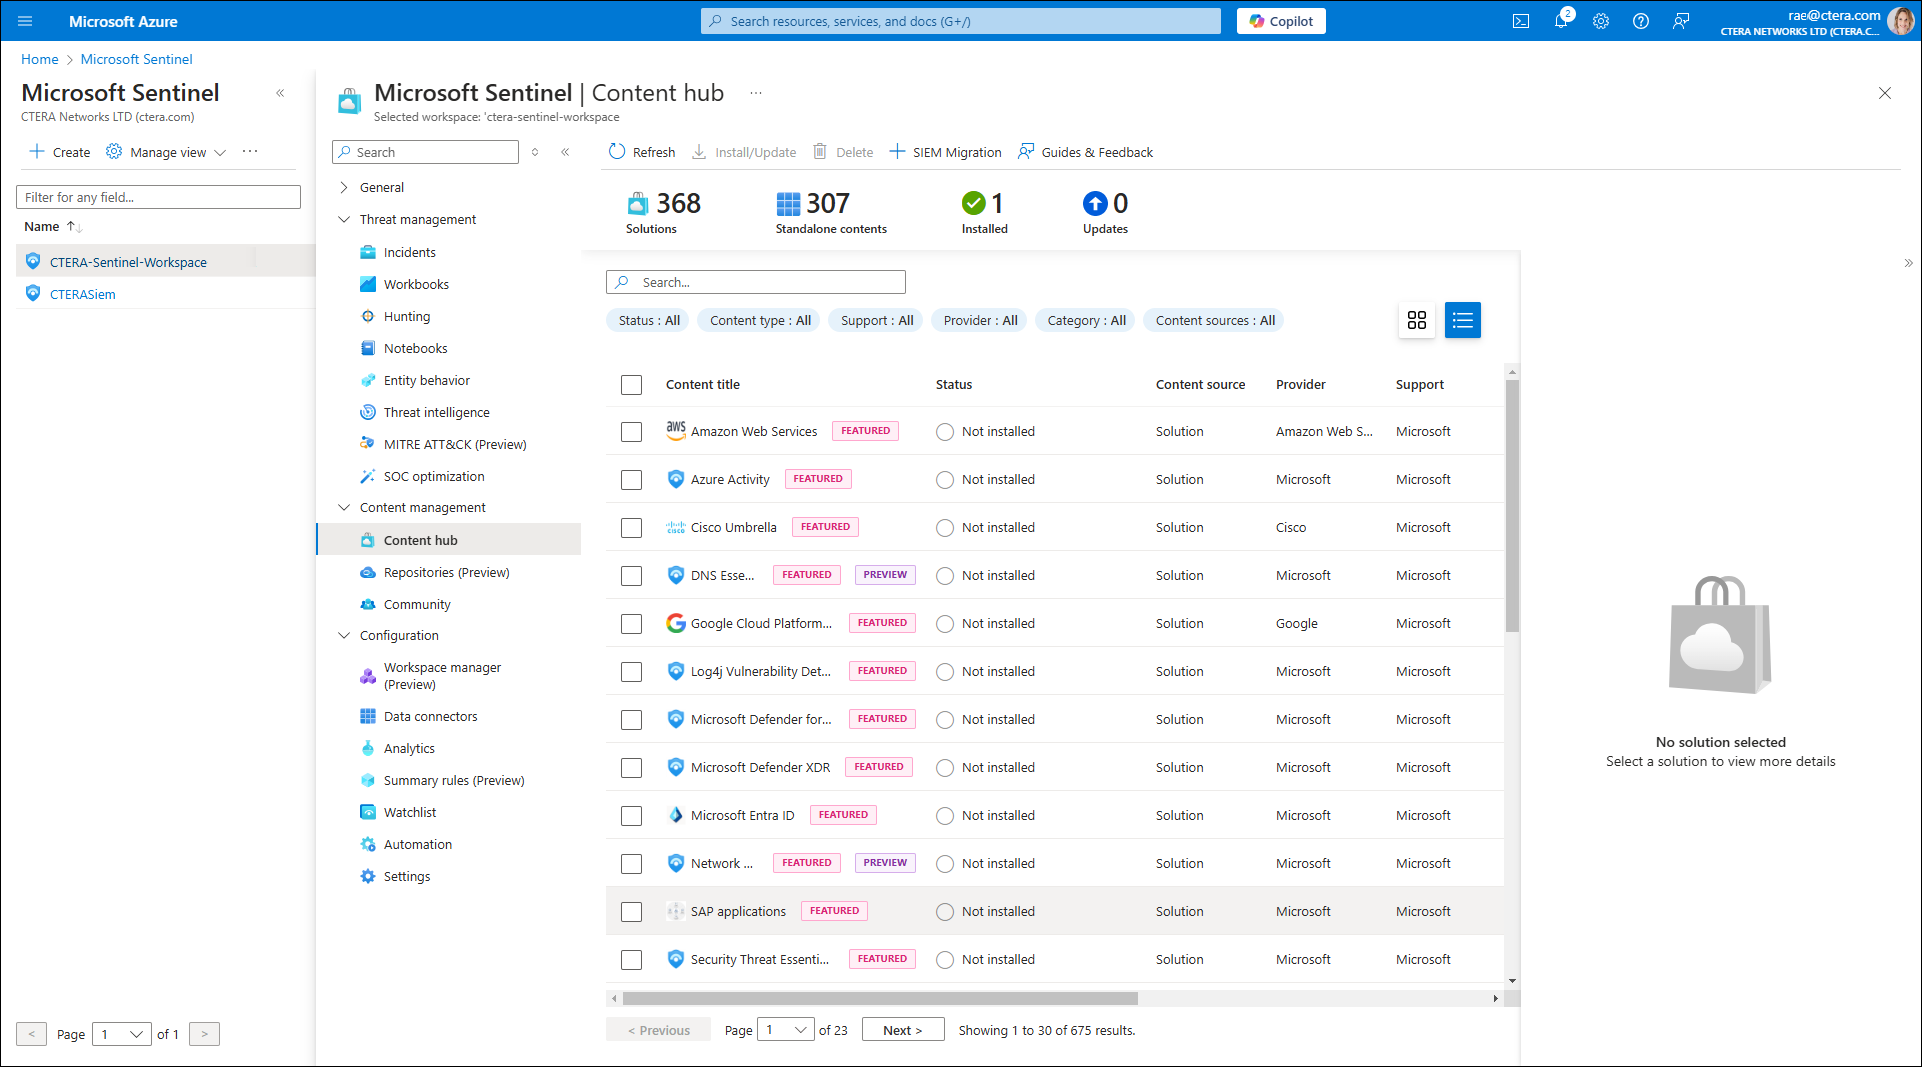
- Search for CTERA Sentinel and select it from the Content title list.
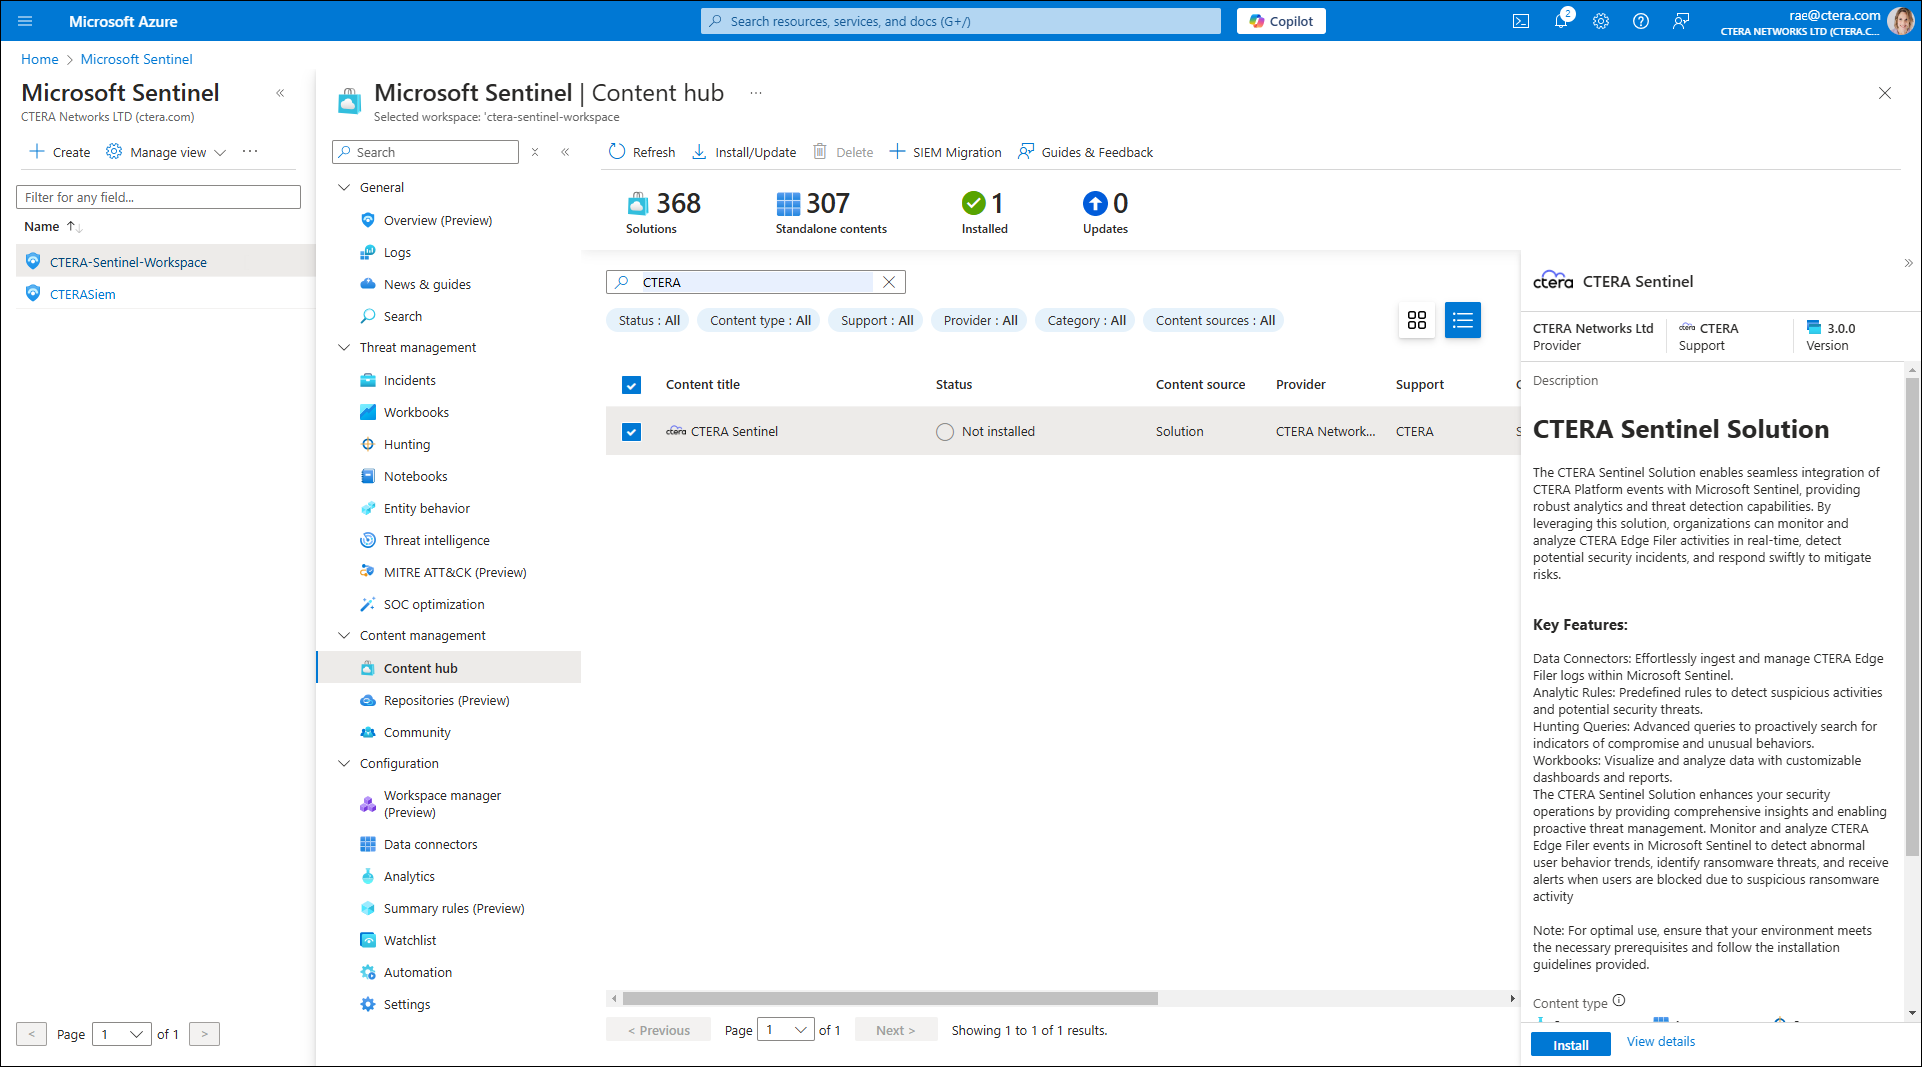
- Click Install/Update.
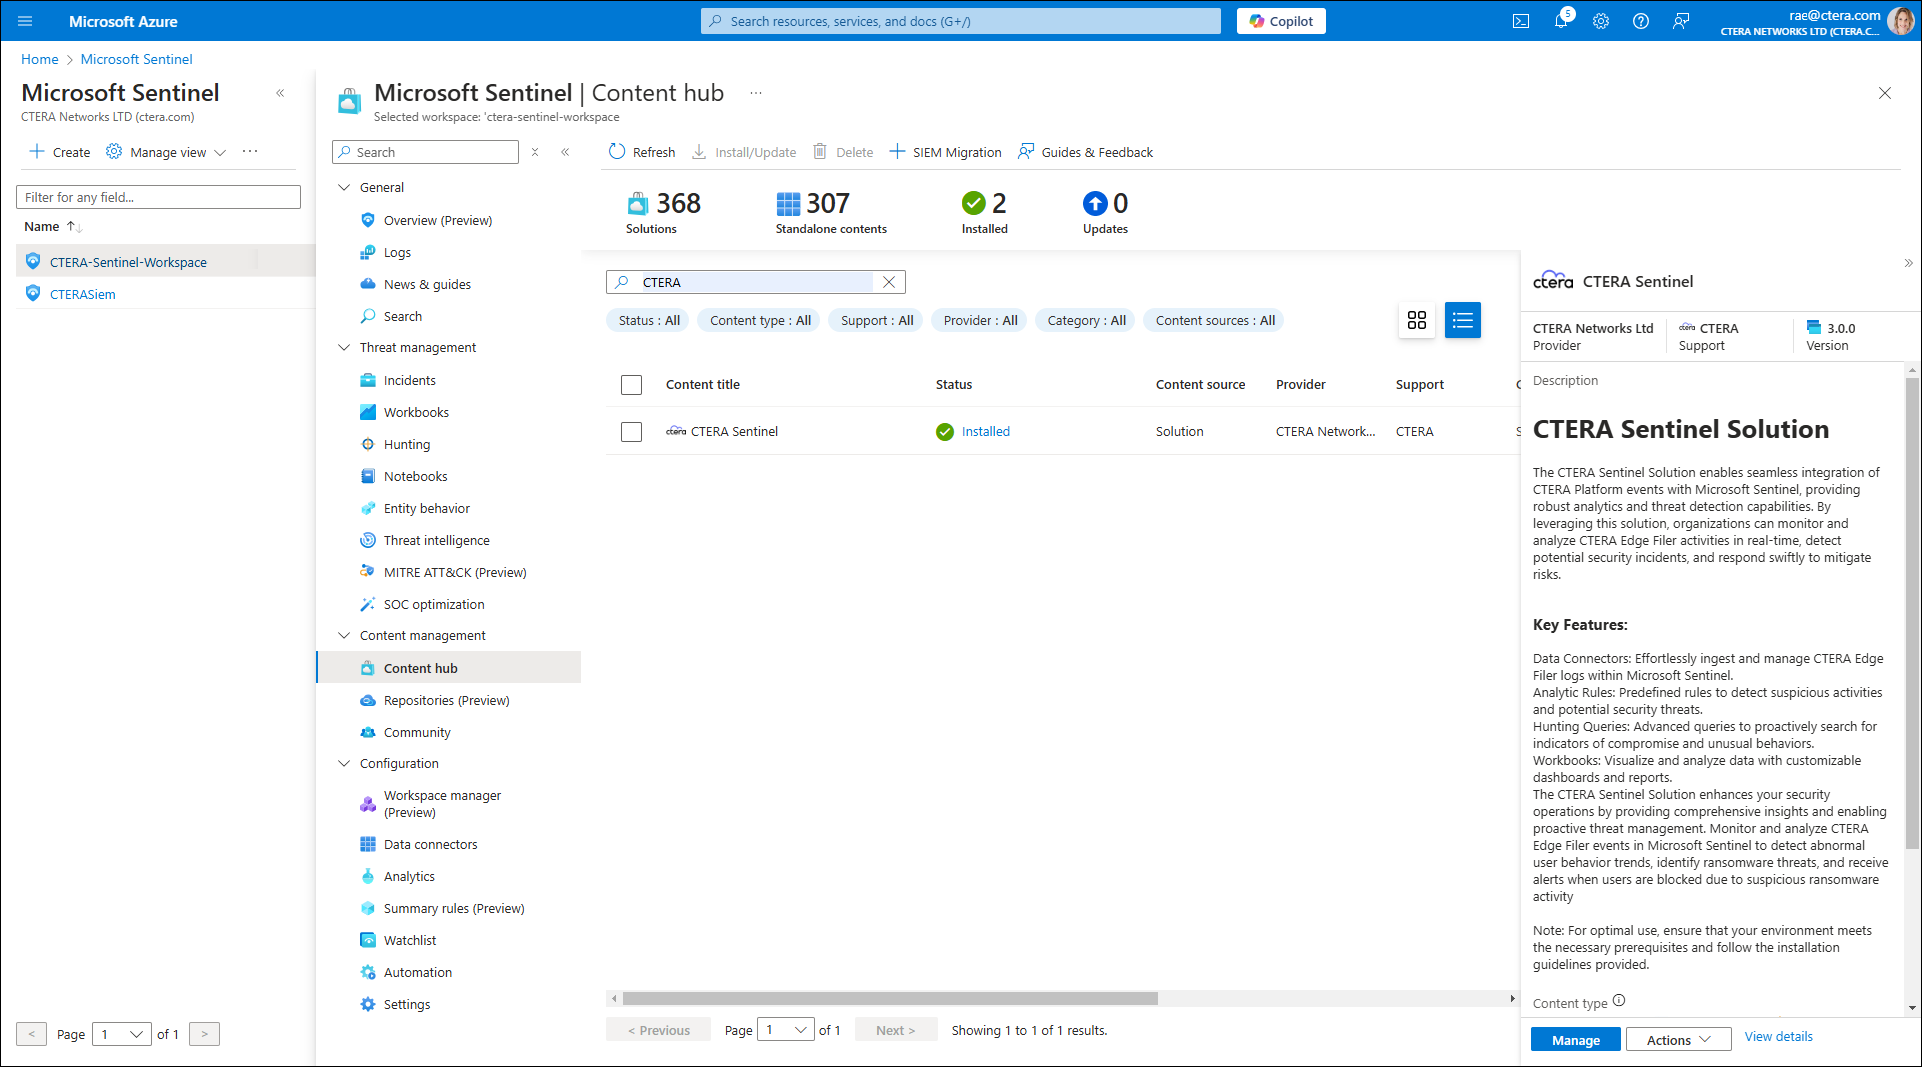
CTERA Sentinel is now installed in the Microsoft Sentinel Content hub.
It takes time for the logs from the CTERA Edge Filer and CTERA Portal to be fed into the system. Once connected, the data connector symbol turns green.
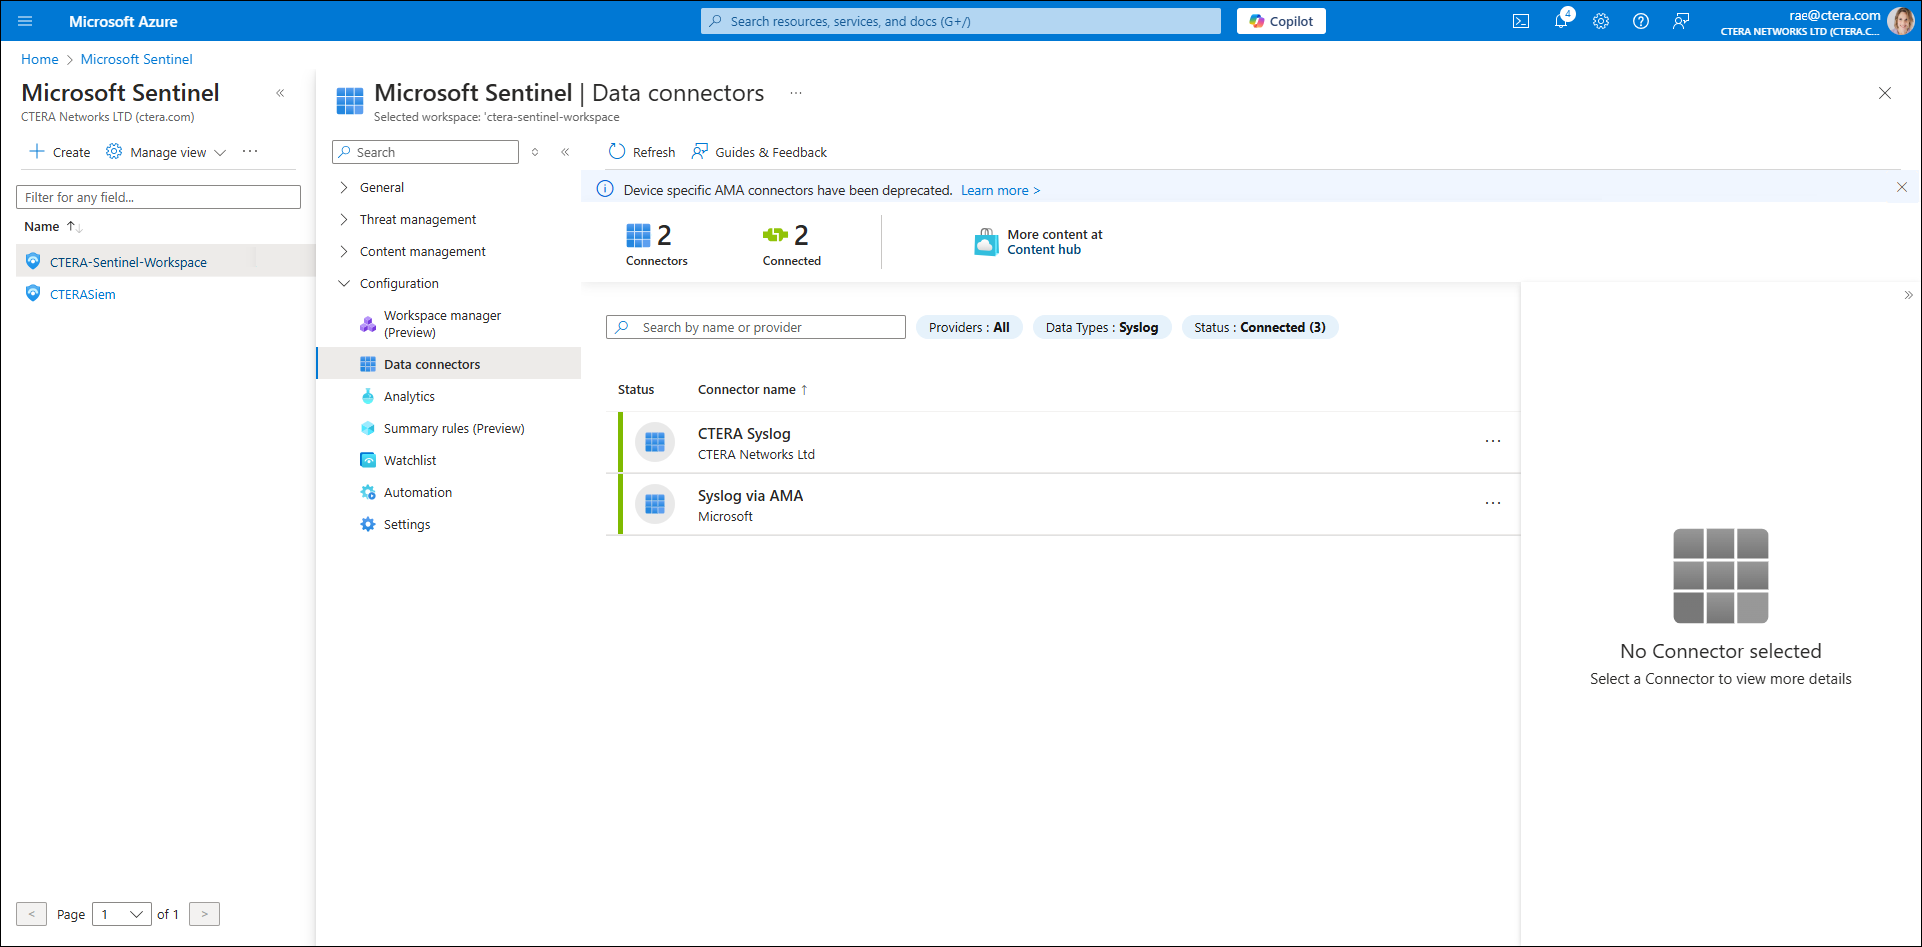
The Syslog data connectors are added automatically.