Accessing and Enabling CTERA Sentinel Tools
- In Microsoft Azure, access Microsoft Sentinel and select the required Log Analytics Worskpace.
- The Overview (Preview) screen is displayed.
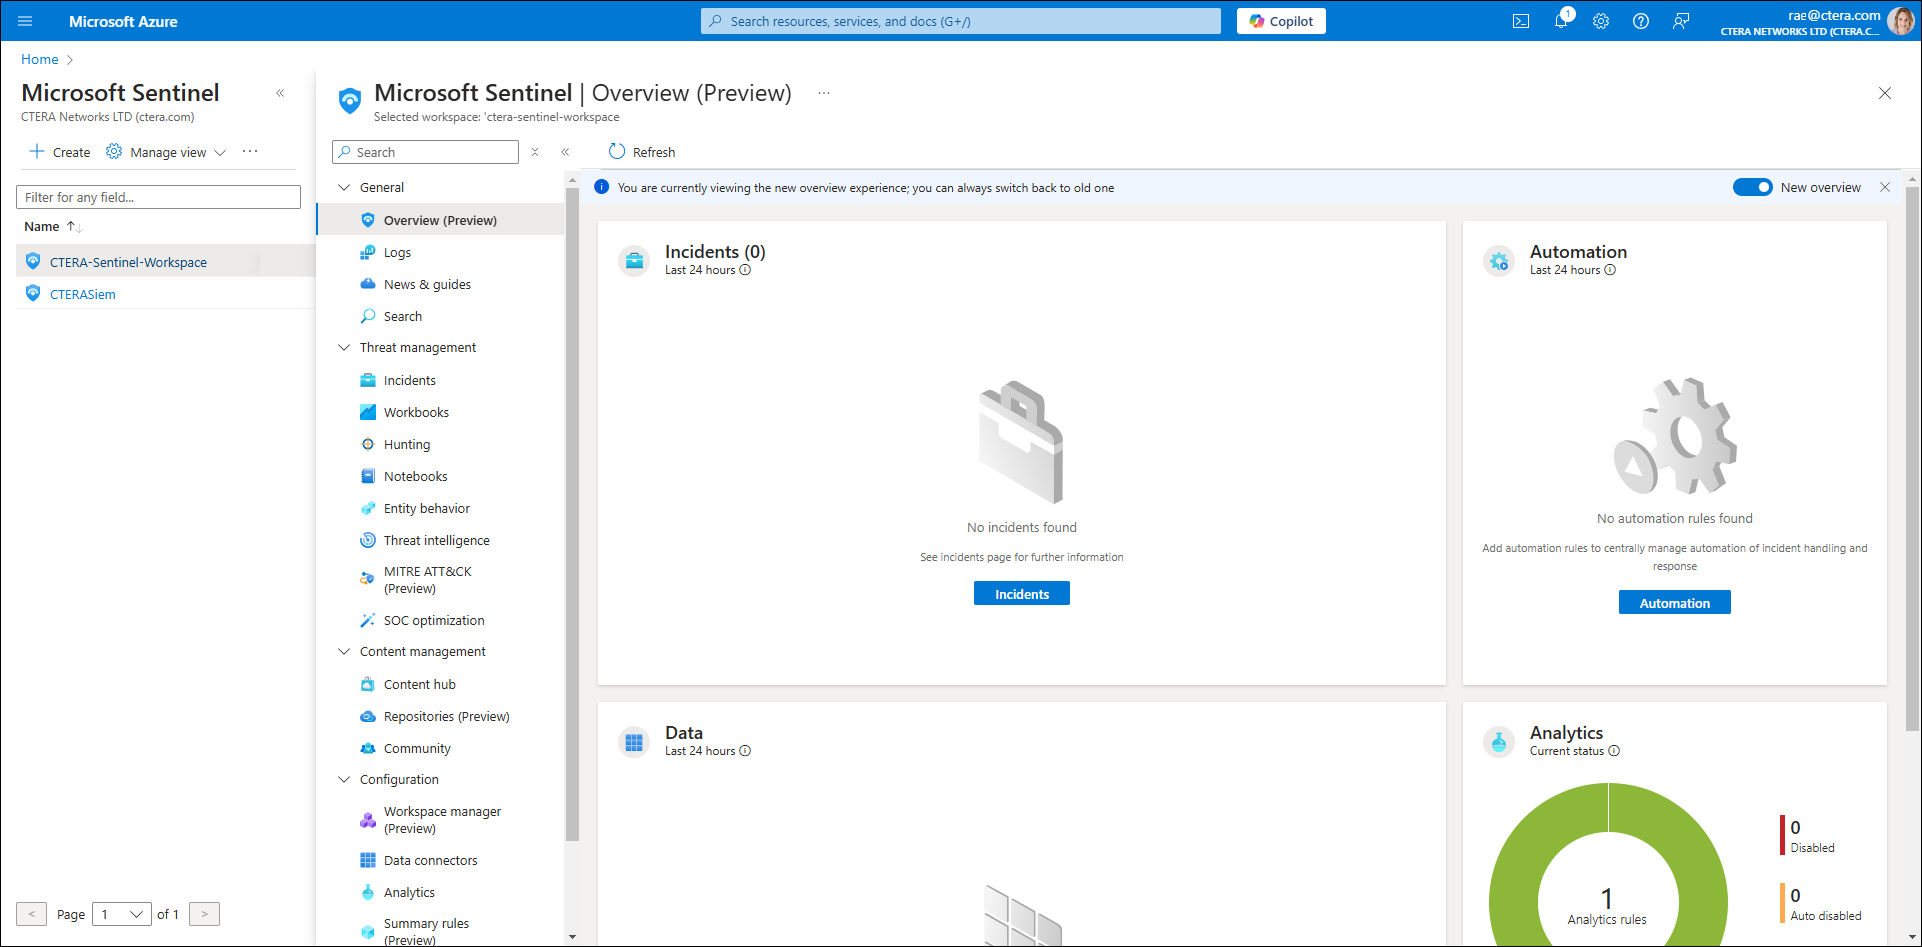
From here, you can access, view and manage:- Workbooks
- Analytics
- Hunting
Enabling the CTERA Workbook
Workbooks enable you to visualize and monitor your data to know what’s happening across all your connected data sources.
To enable the CTERA Sentinel Workbook:
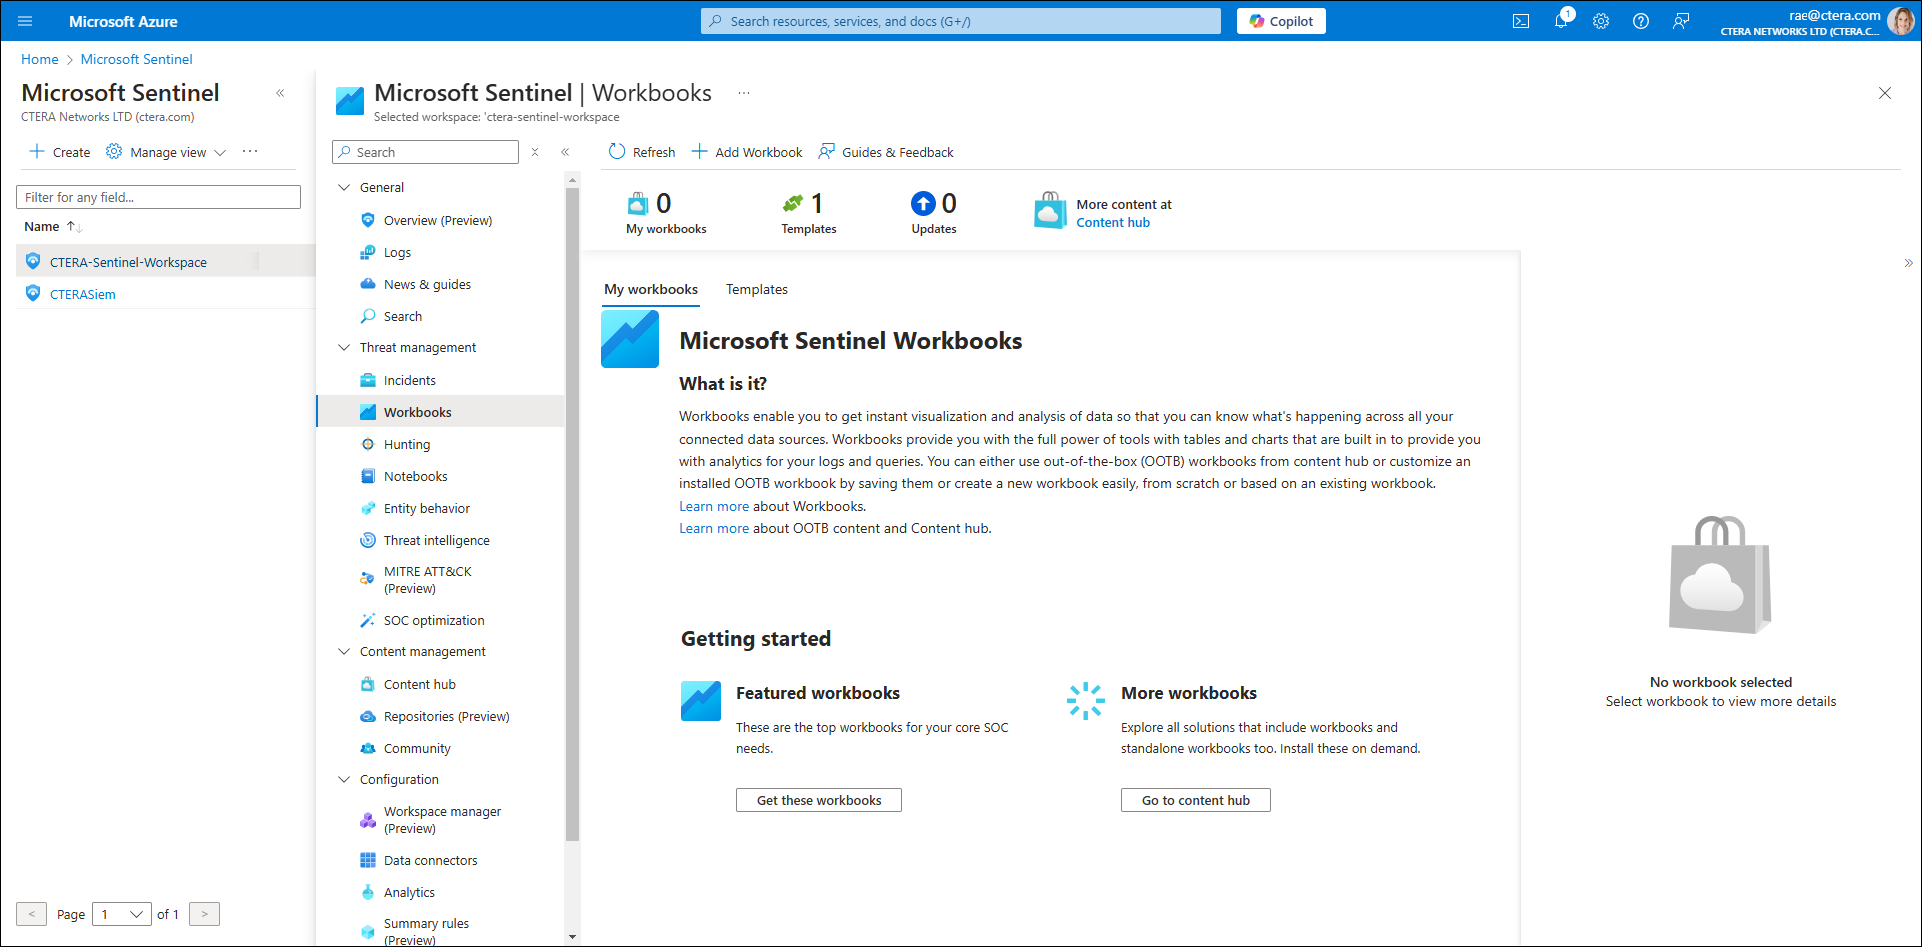
- In Microsoft Sentinel, select the required Log Analytics Workspace.
The Overview (Preview) screen is displayed. - Select Workbooks.
The Workbook screen is displayed.
- Click Templates to view CTERA Workbook templates.
A list of templates is displayed.
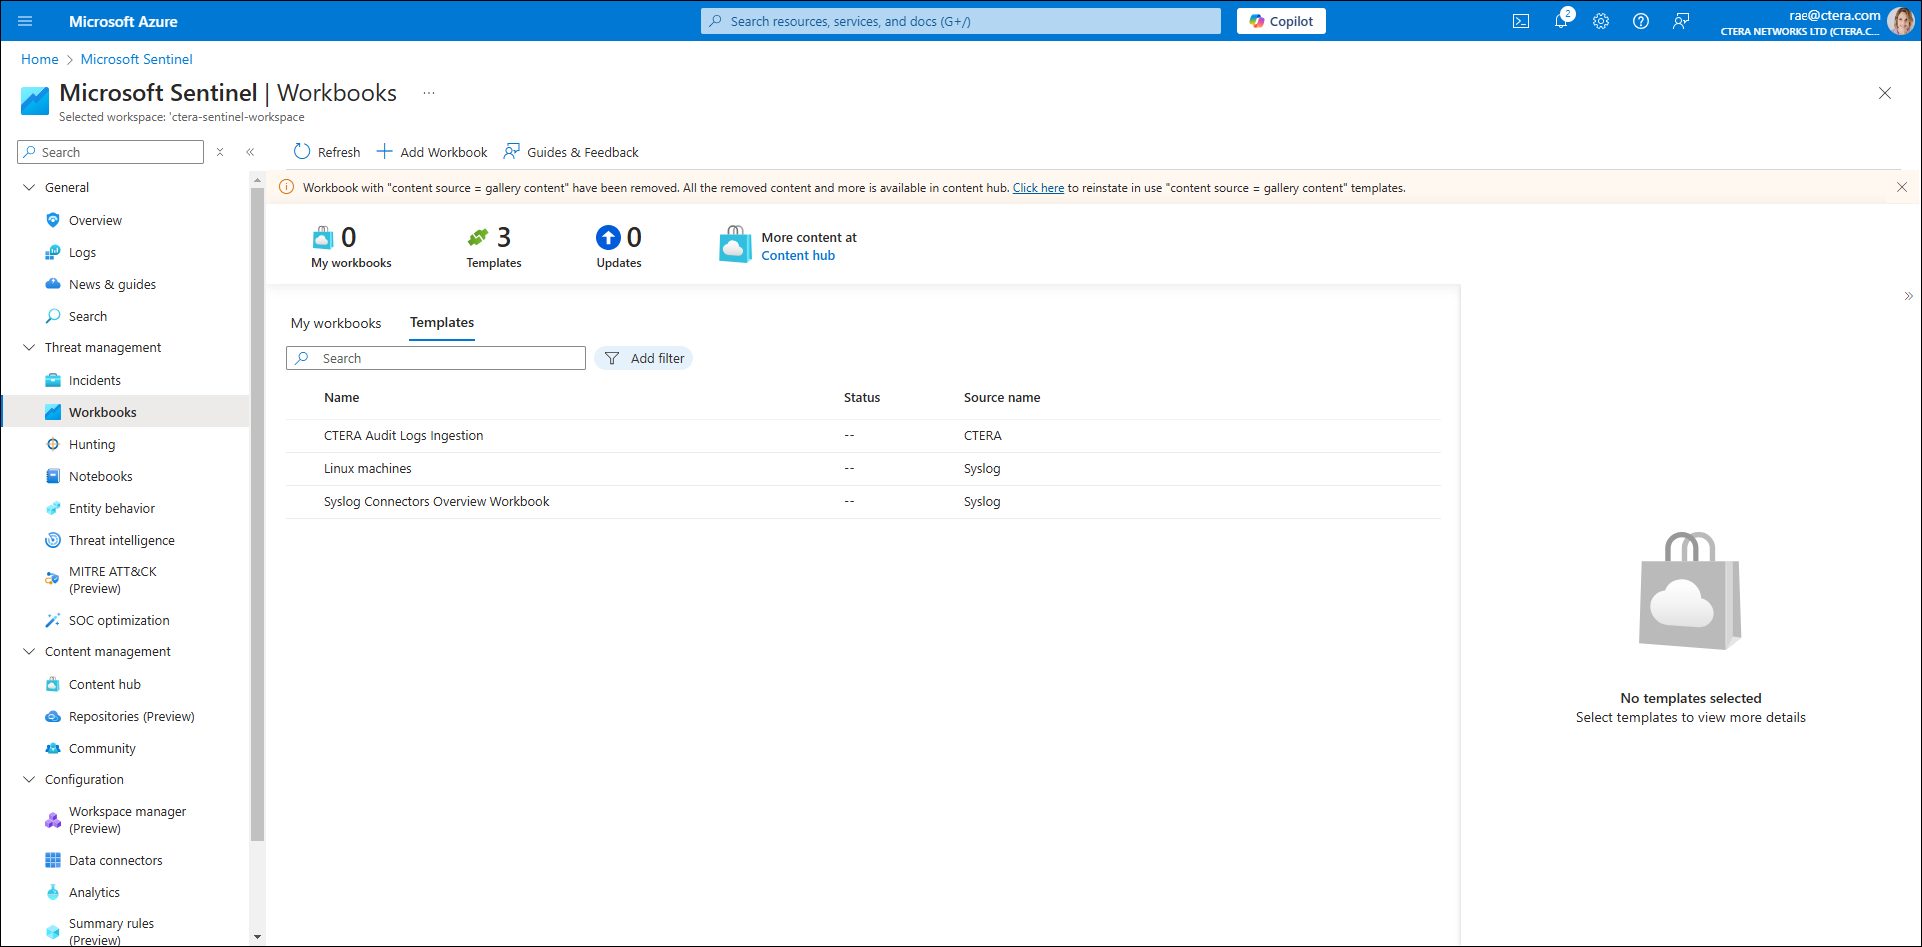
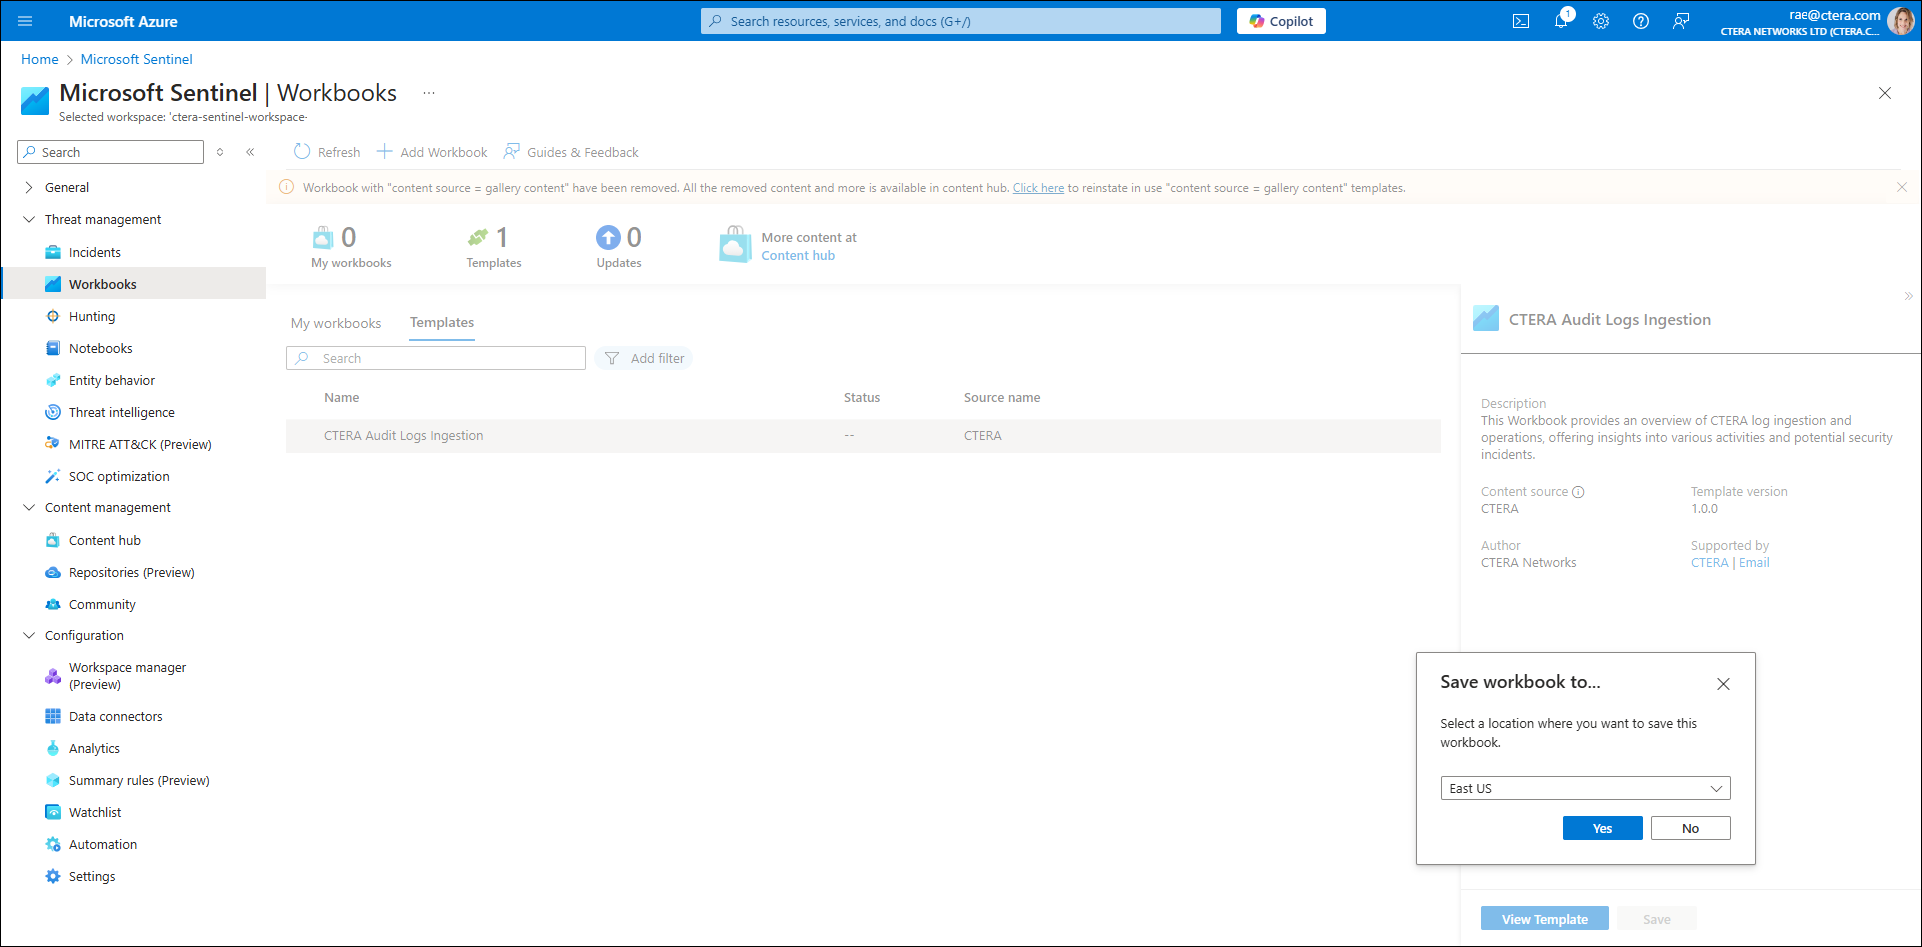
- Select CTERA Audit Logs Ingestion.
This workbook provides an overview of CTERA log ingestion and operations, offering insights into various activities and potential security incidents. - Click Save and then select the location where you want to save the workbook.
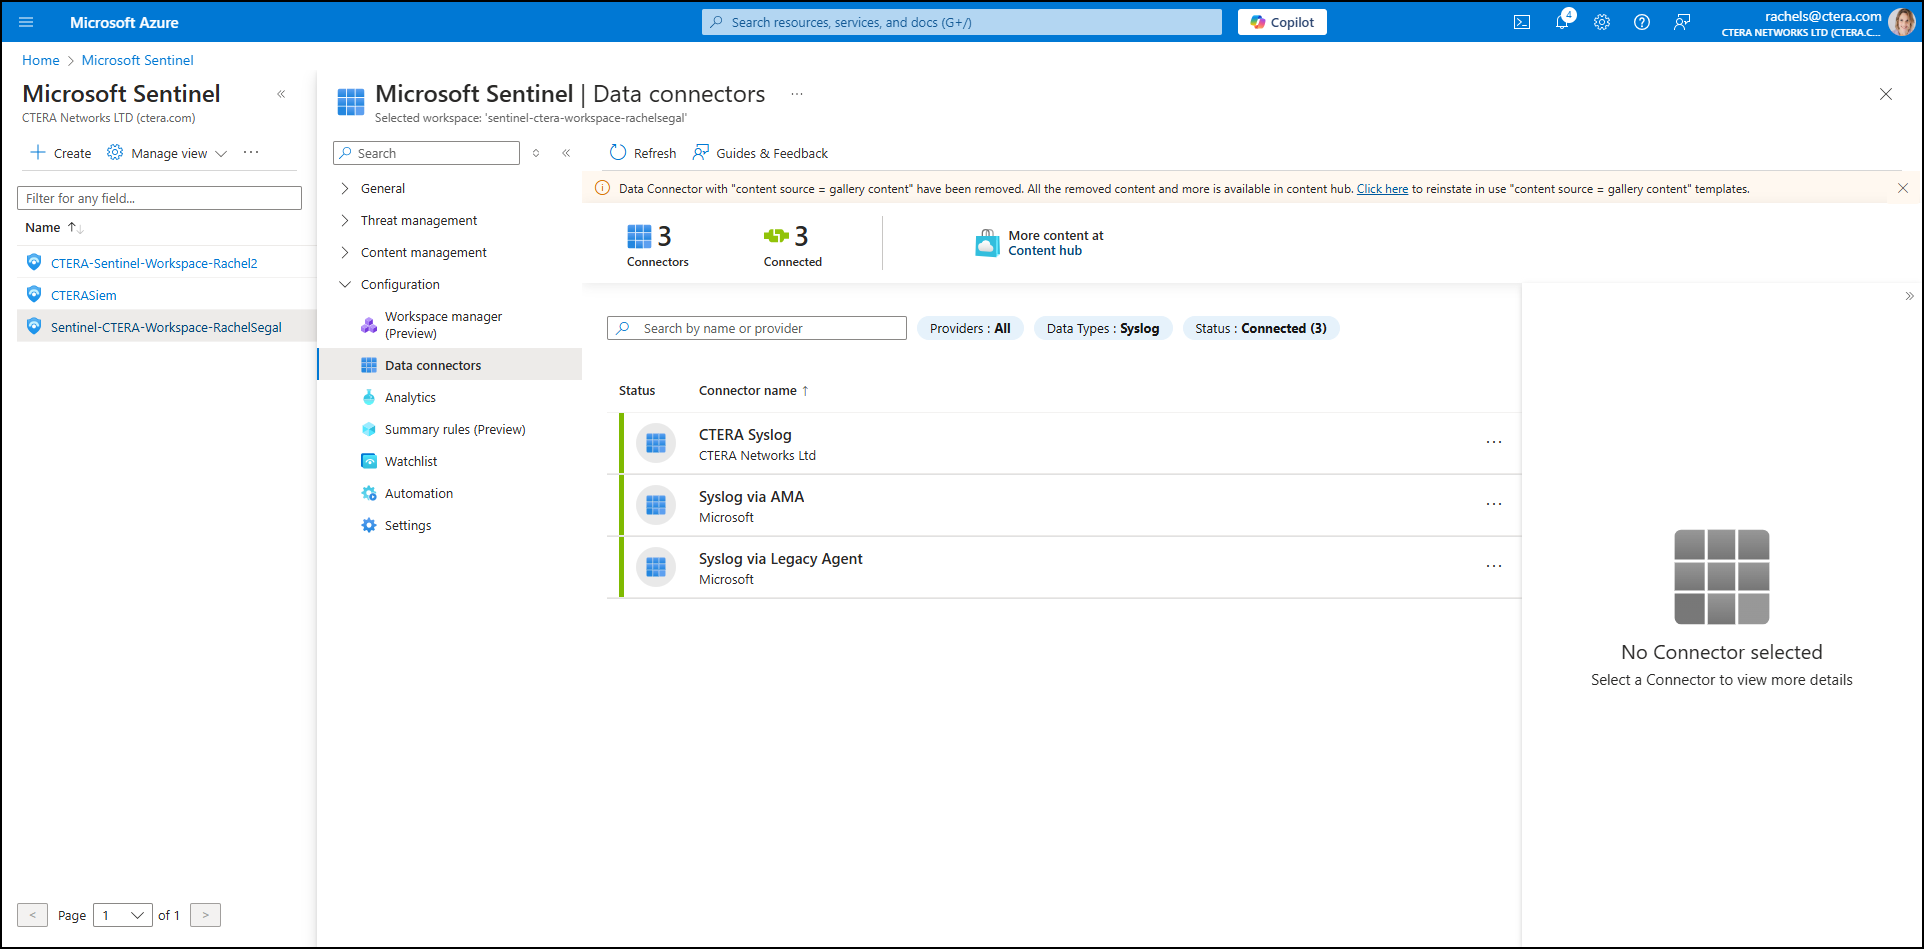
Enabling Analytics Rules
To enable Analytics rules:
- In Microsoft Sentinel, select the required Log Analytics Workspace.
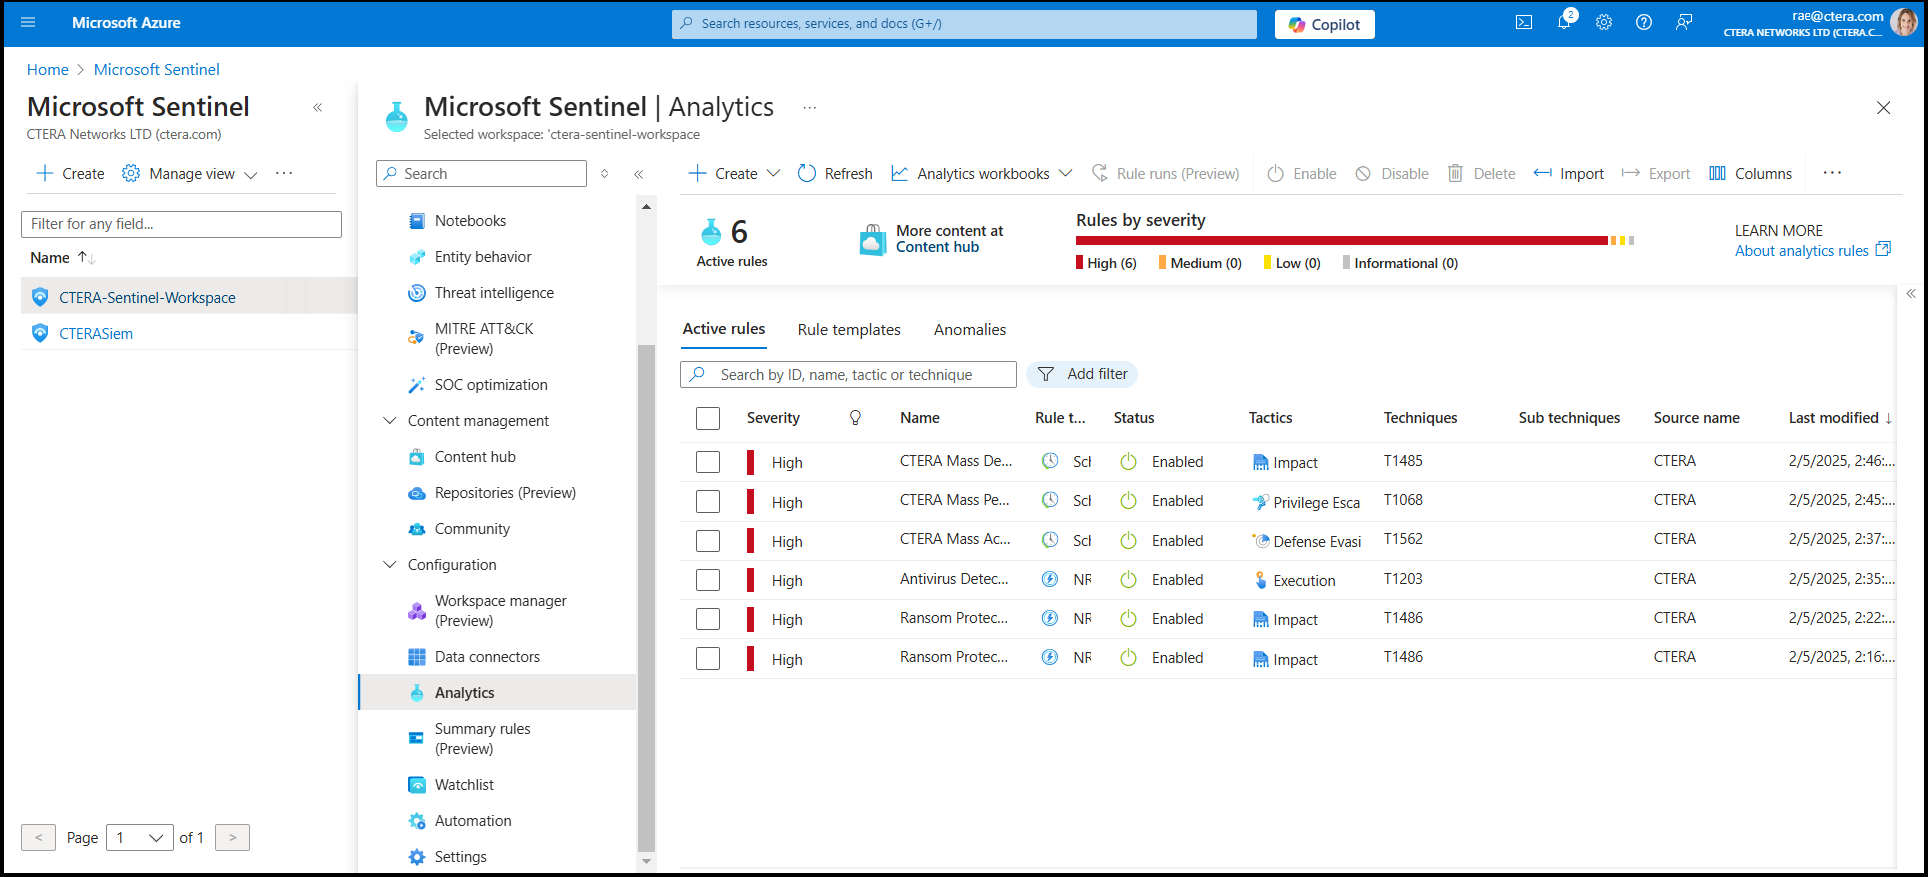
The Overview (Preview) screen is displayed. - Select Analytics listed under Configuration.
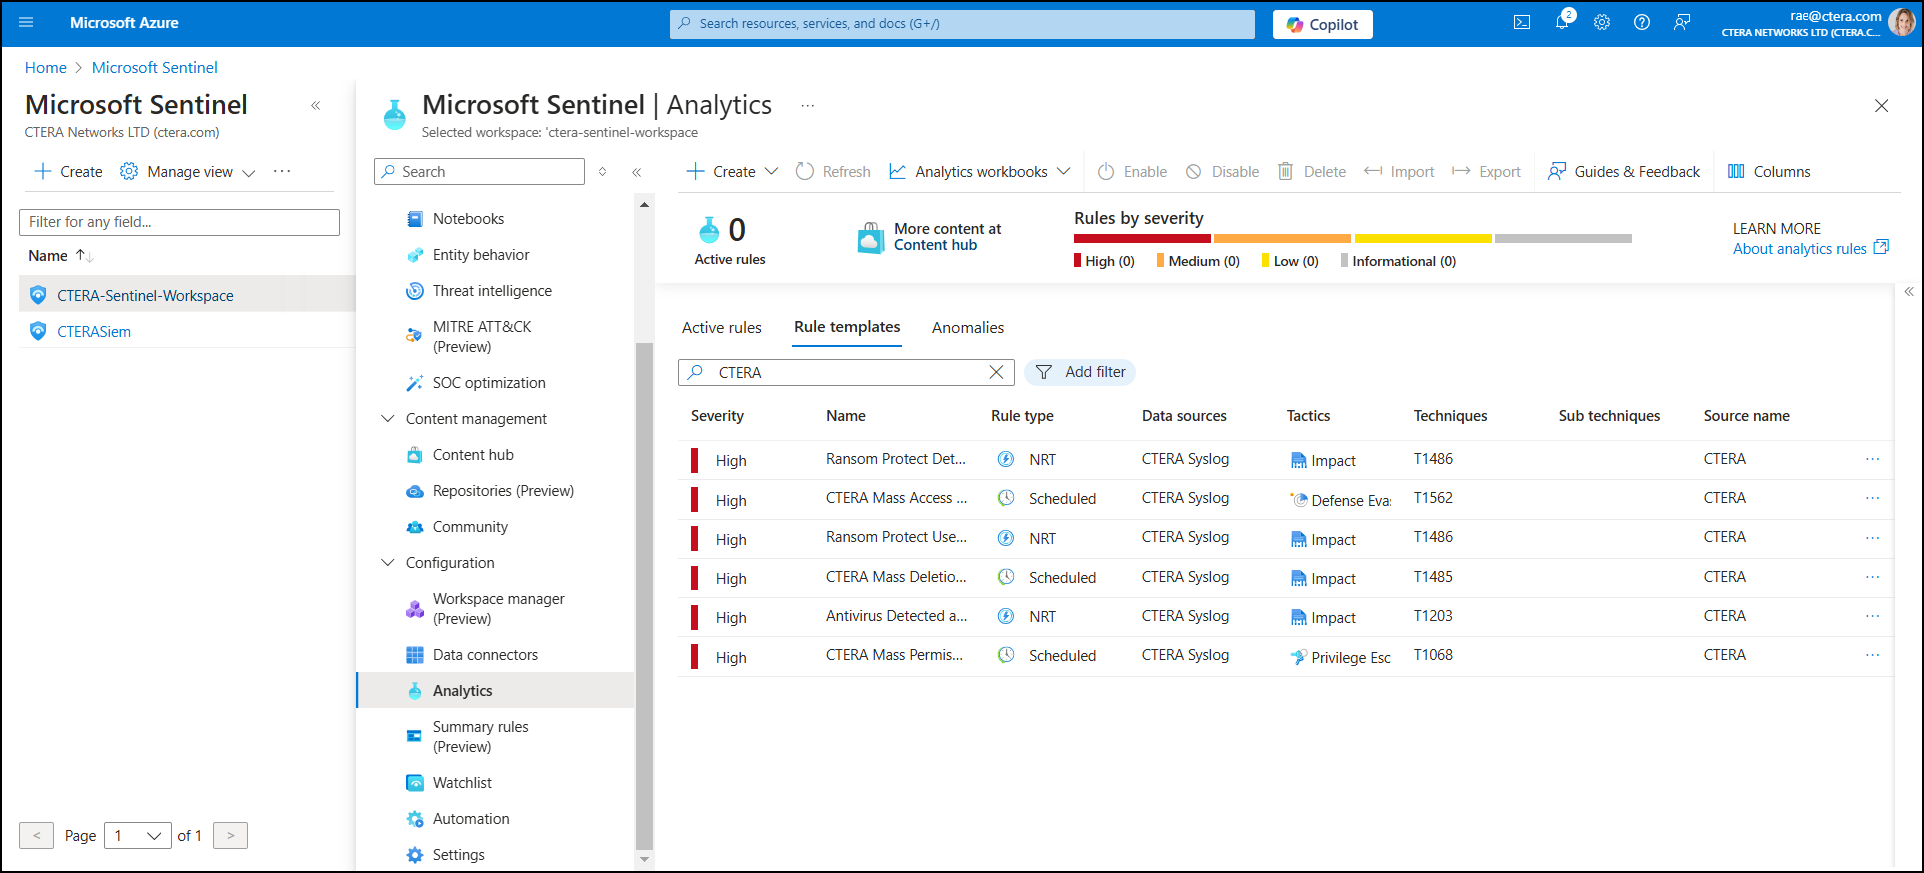
The Analytics screen is displayed, showing active rules, templates, and anomalies.
- Click Rule templates.
A list of analytics rules is displayed.NoteAnalytics rules in CTERA Sentinel:
- Ransomware Detection
- Ransomware User Blocked
- Ransom Mass Access Denied Detection
- Ransom Mass Deletions Detection
- Ransom Mass Permission Changes Detection
- Antivirus Detected an Infected File
- Search for
CTERAin the search box of the Analytics Rule Templates.
An Analytics rule wizard screen is displayed that enables you to create a new scheduled rule. - Complete the fields as follows:
Severity – Select High, Medium, Low, or Informational.
MITRE Attack – Leave the default.
Status – Leave theEnableddefault.
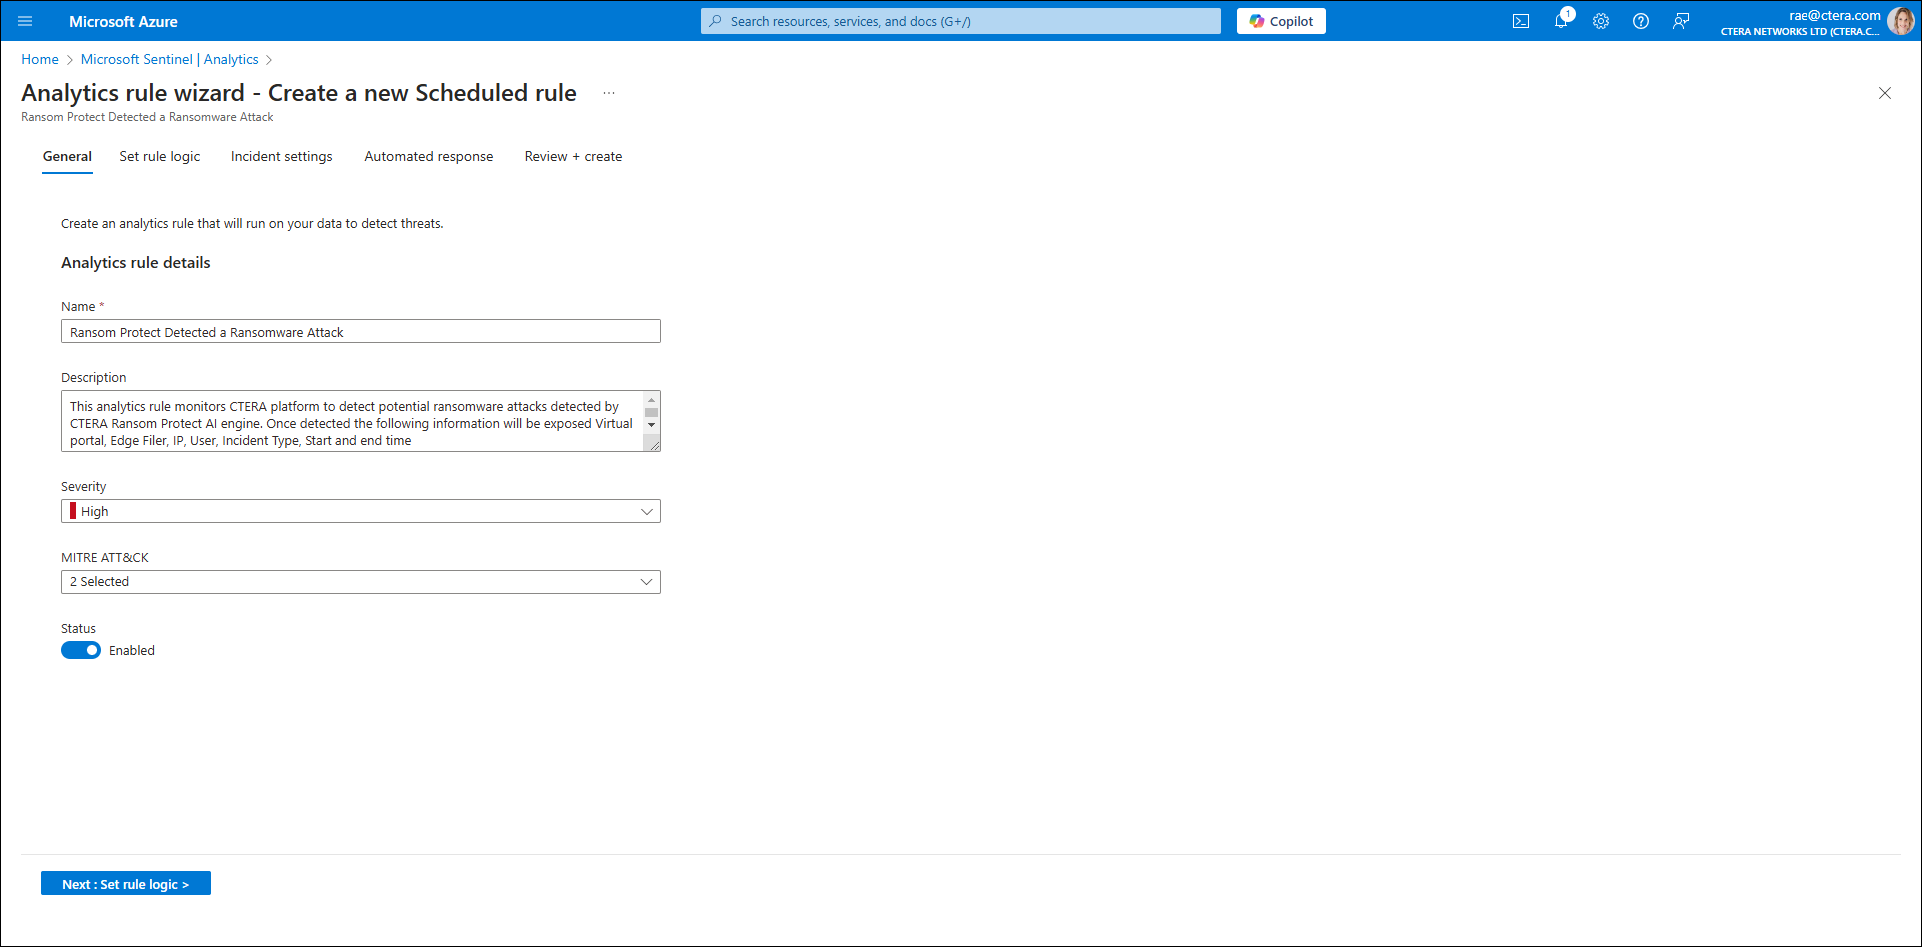
- Click Next: Set rule logic.
Options to define the logic for your new analytics rule are displayed.
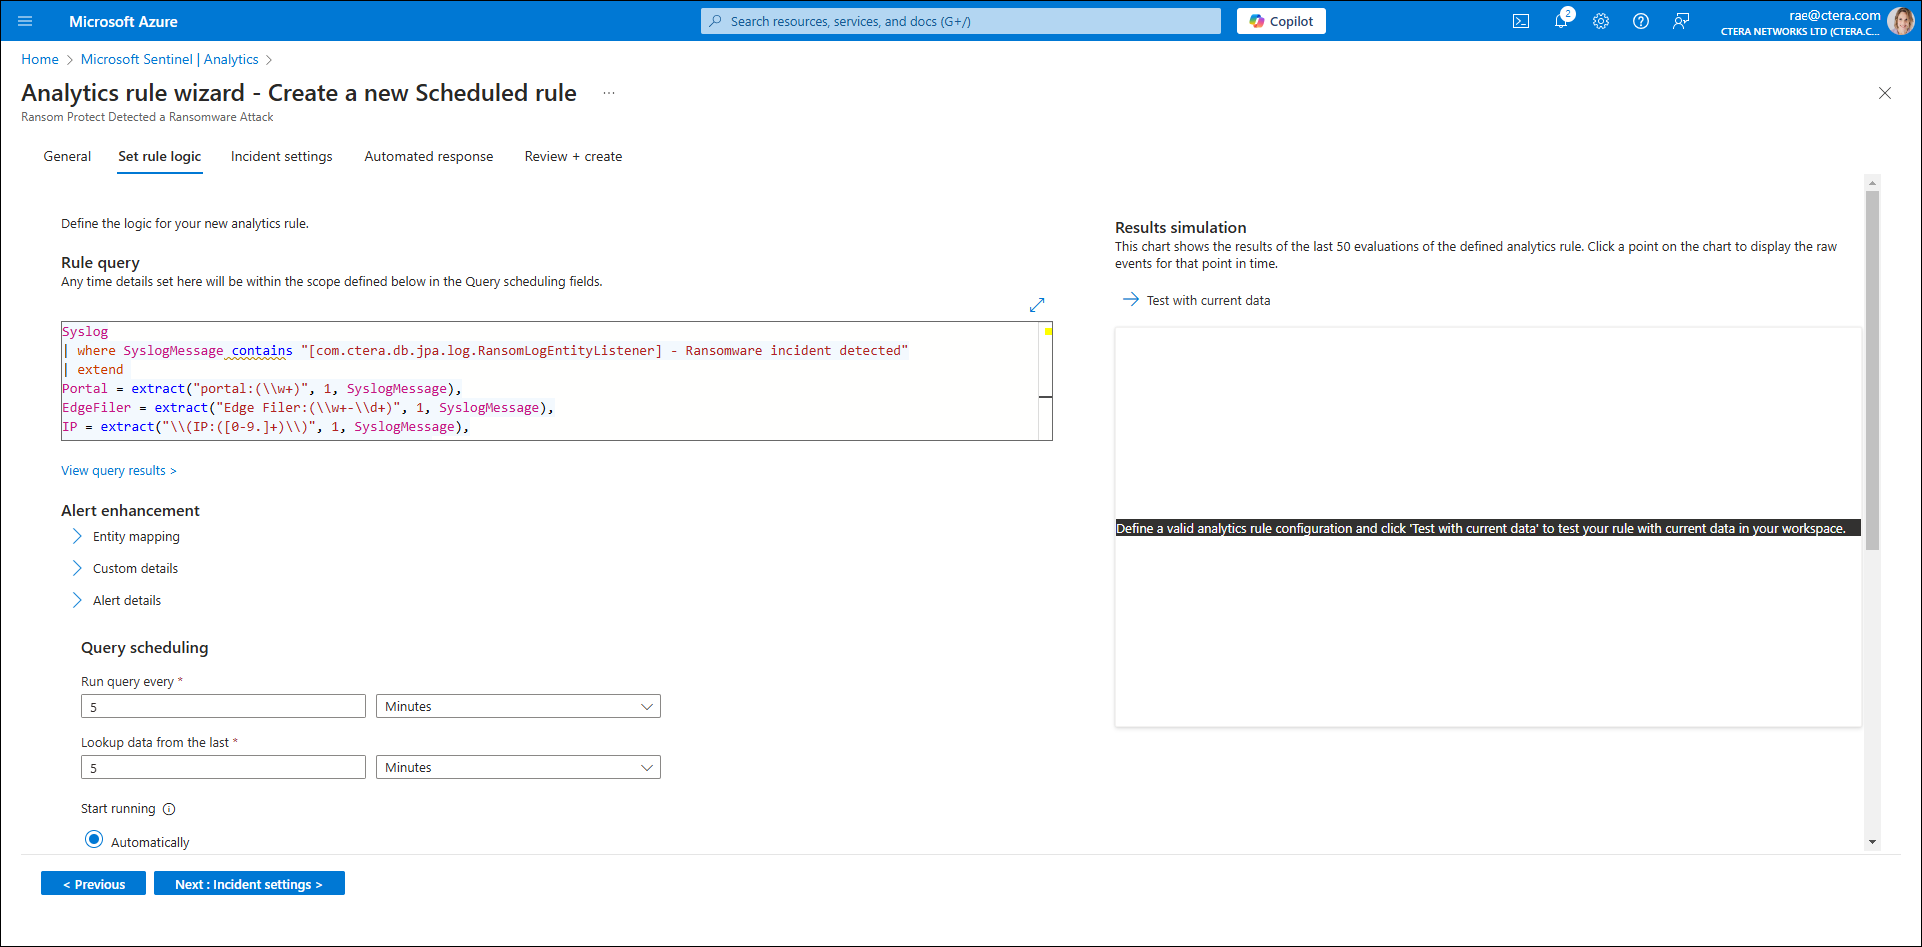
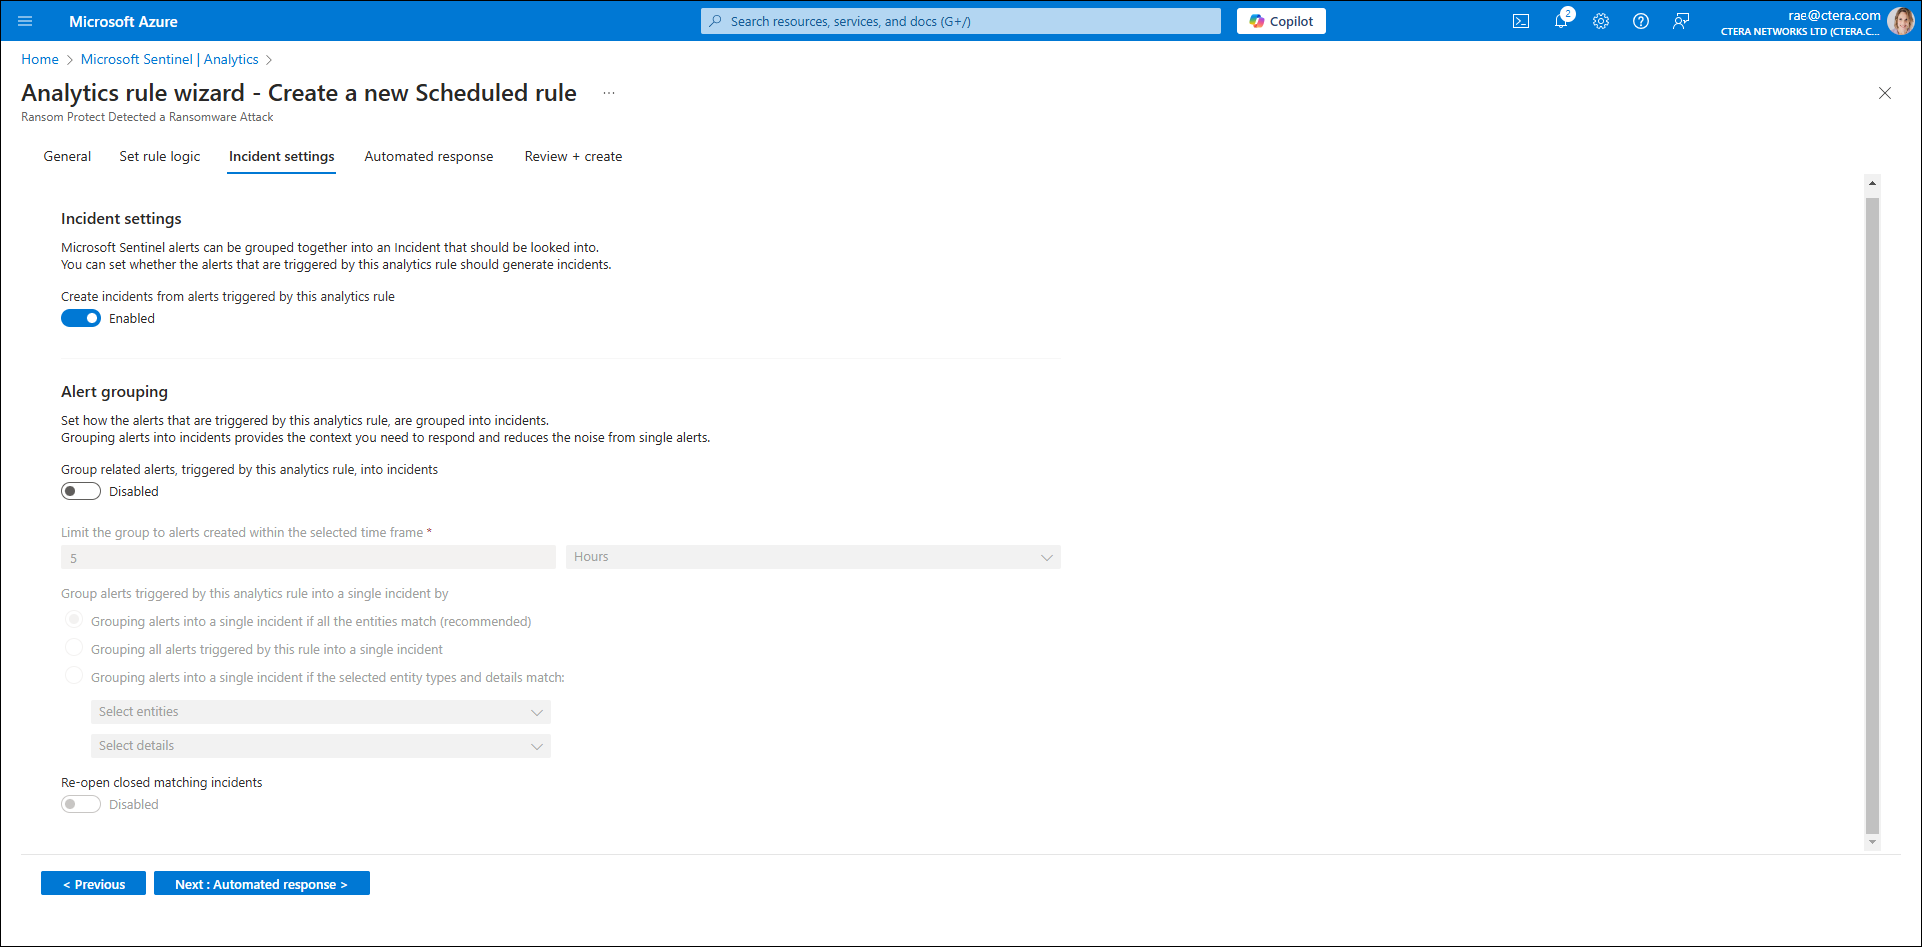
- Click Next: Incident settings.
An Incident settings screen is displayed with the following options:
Incident settings – Enables creating incidents from alerts.
Alert groupings – Enables grouping related alerts.
- Click Next: Automated response.
The Automation rules screen is displayed, enabling viewing of all automation rules and creating new automation rules.
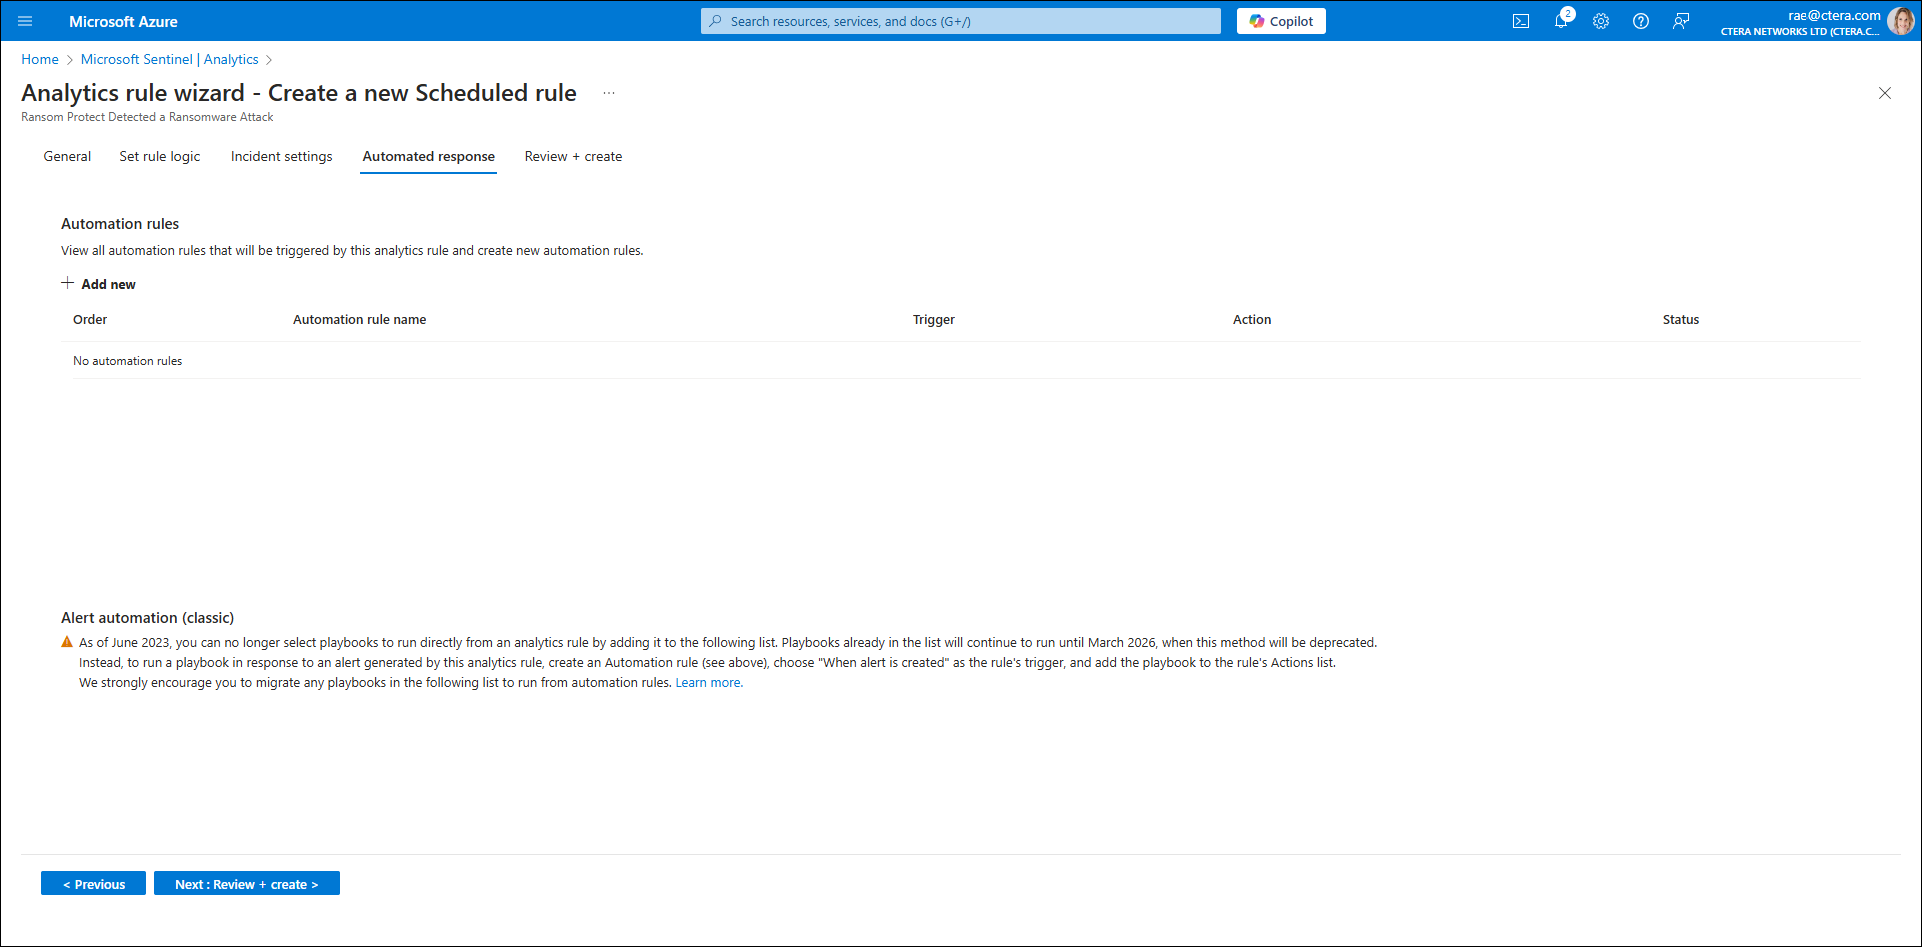
- Click Next: Review + Create and then Save.
The analytics rule is now enabled and active. - Repeat the same steps to enable the Ransom Protect User Blocked rule.
Note
Analytics rules can be edited.
To edit active Analytics rules:
- Click Active rules.
- Select the relevant analytics rule and click Edit.
Screens are displayed with options to enable editing in each of the steps where analytics rule details were previously defined.
Enabling Hunting
Hunting enables the active search for unusual behaviors or threats across your environment by running specific queries.
To run a hunt:
- In Microsoft Sentinel, select the required Log Analytics Workspace.
The Overview (Preview) screen is displayed. - Select Hunting listed under Threat management.
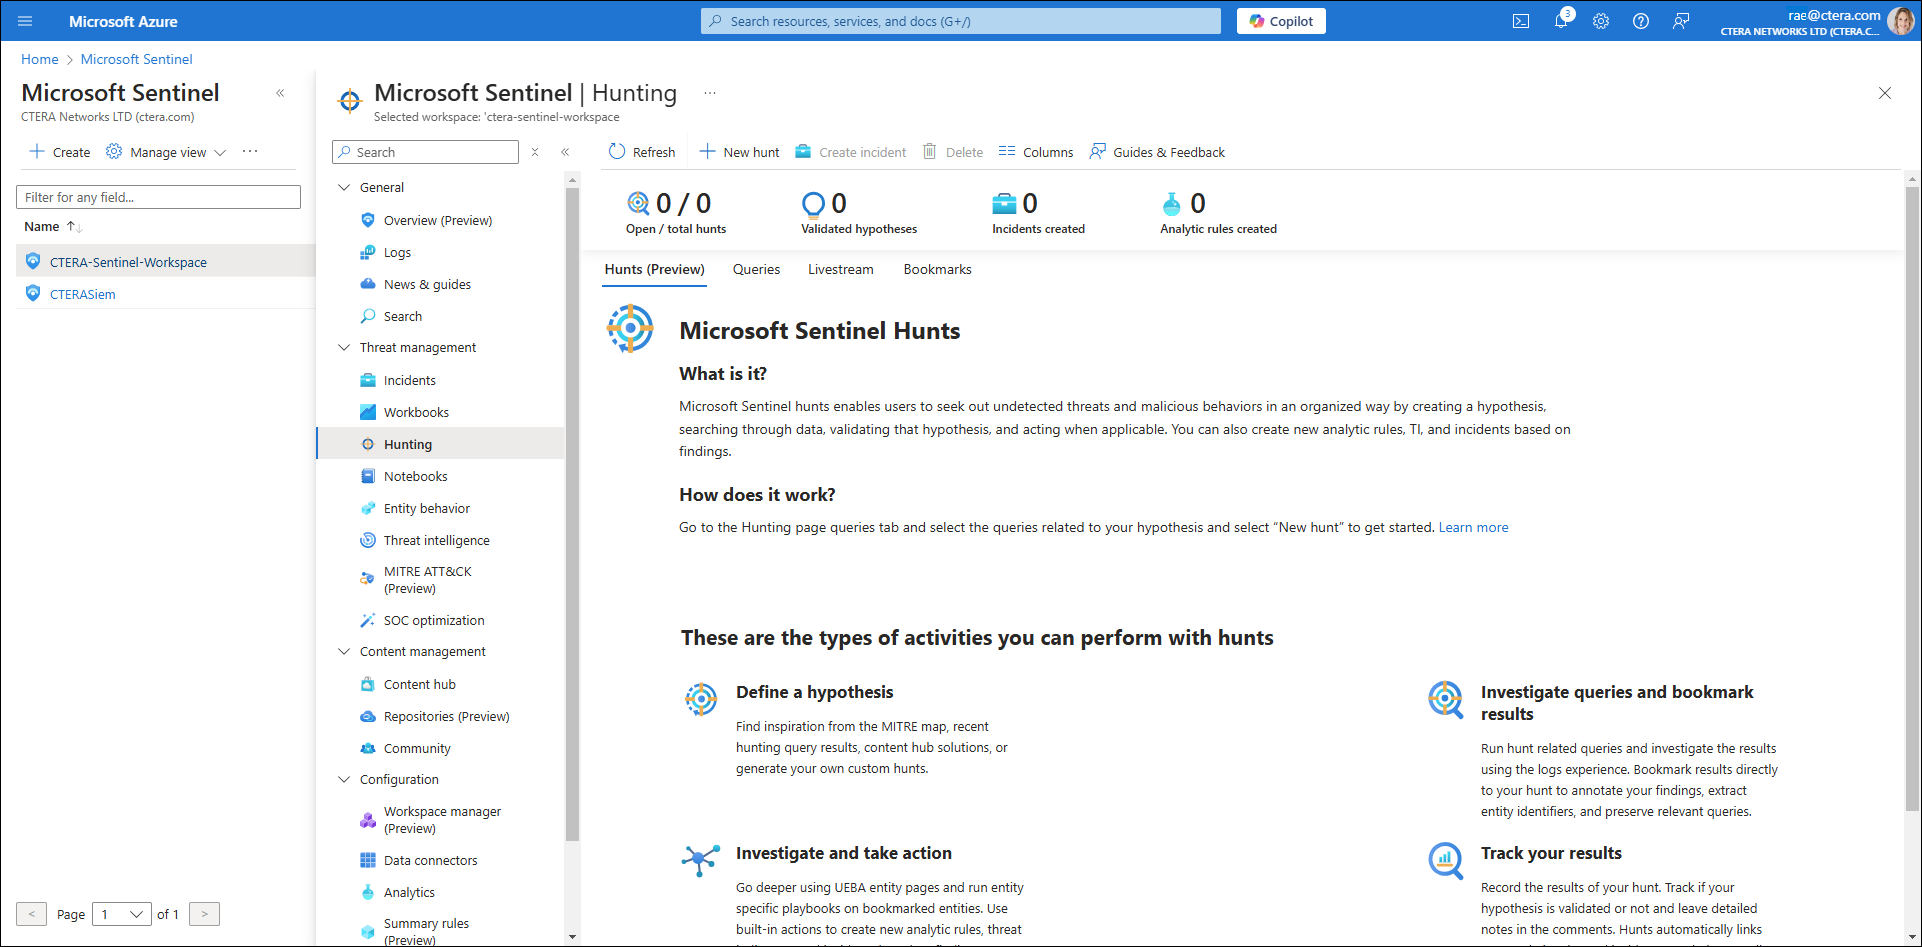
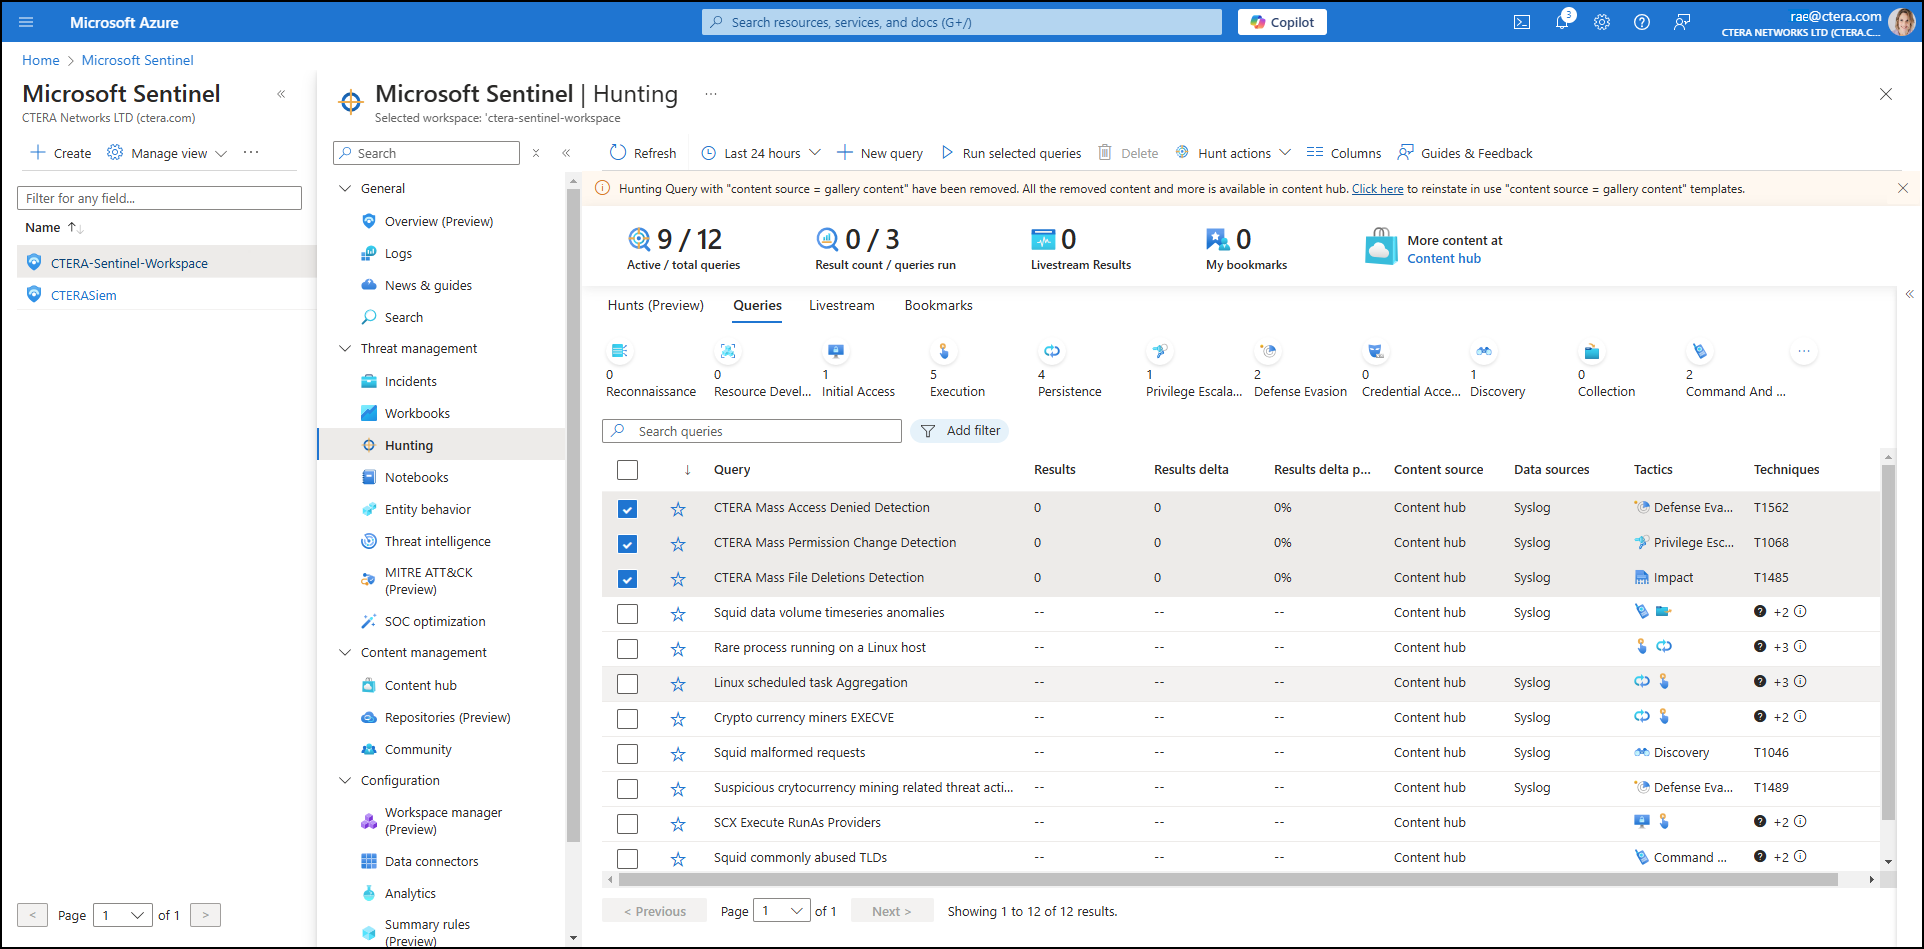
The Hunting screen is displayed. - Click Queries.
A list of hunting queries are displayed.
These include the following hunts, which are currently in CTERA Sentinel:
CTERA Access Denied Detection – Tracks when a lot of access attempts are being blocked.
CTERA Batch Permission Changes Detection – Monitors for any unusual modifications to file and folder permissions.
CTERA Batch Deletions Detection – Scans for large-scale file deletions that could signal a problem. - Select the relevant hunt queries and click Run selected queries.
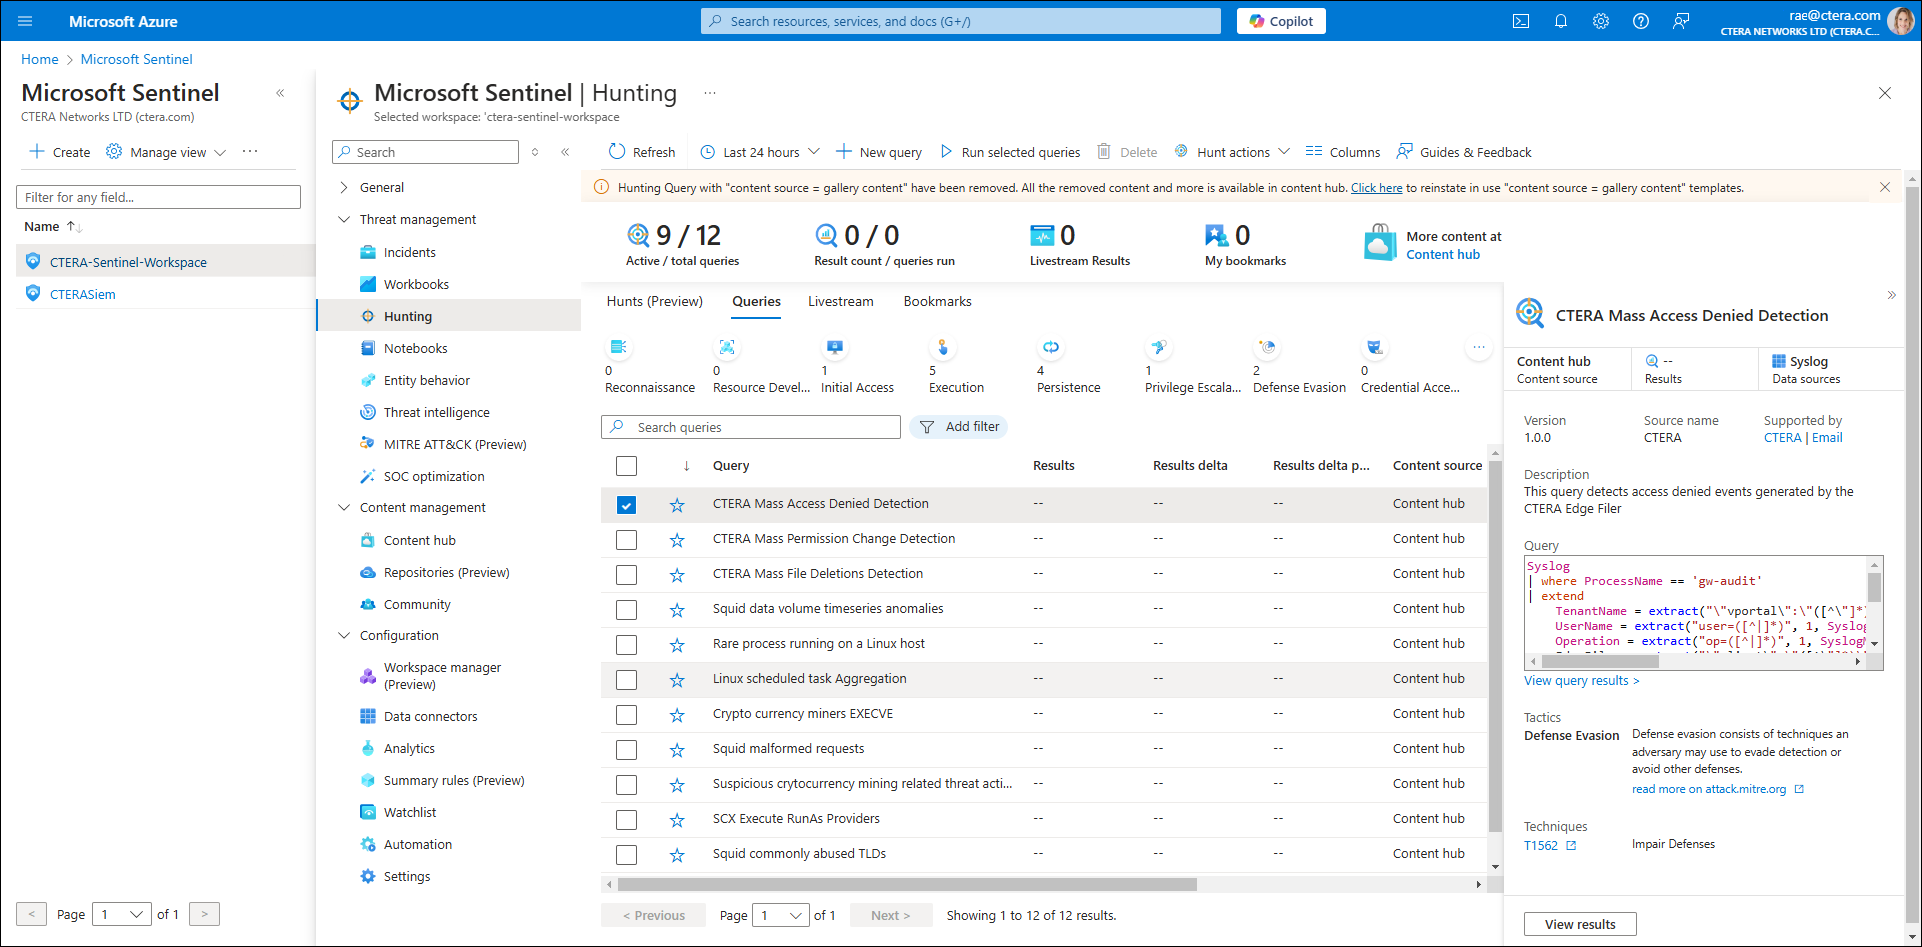
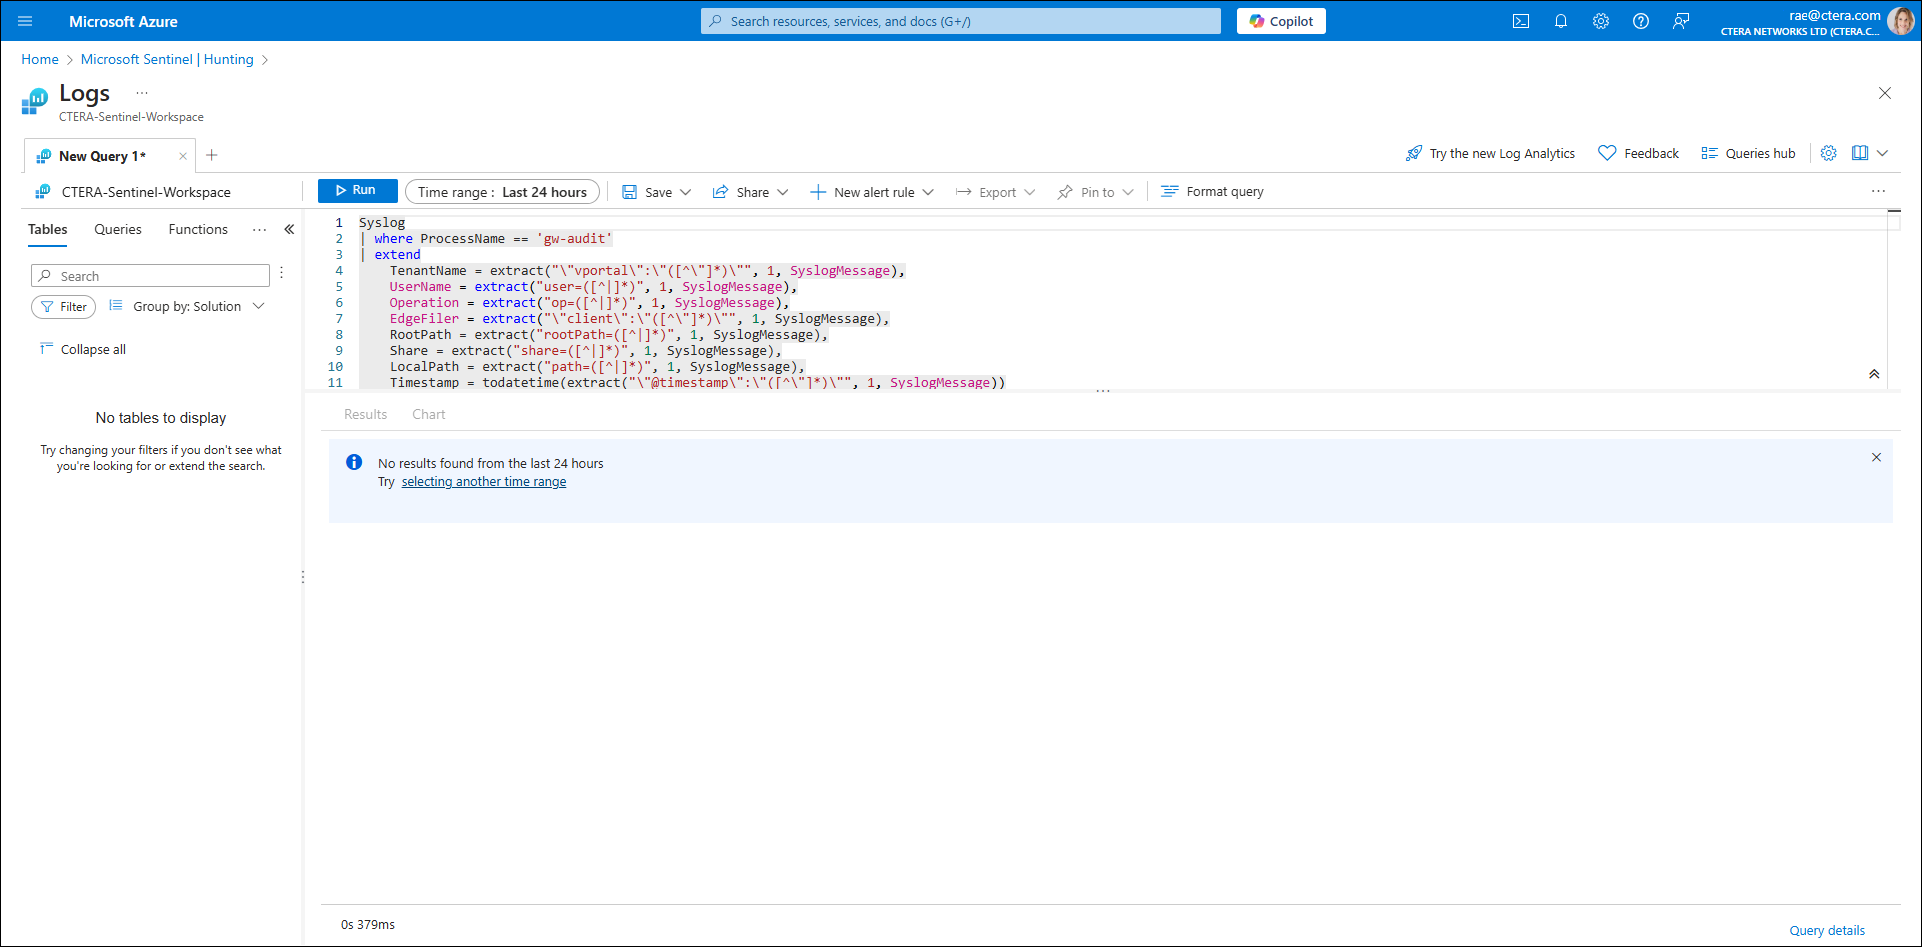
- To view query results, select one hunting query at a time and click View results.
To enable a hunt to run automatically:
- In Microsoft Sentinel, select the required Log Analytics Workspace.
The Overview (Preview) screen is displayed. - Select Hunting listed under Threat management.
The Hunting screen is displayed. - Click Queries.
The list of hunting queries is displayed.

- Either click the blue star next to the hunt or right-click the hunt and select
favorite - Specify the time range that the query will run.
- Click Run.
Note
Hunts are based on the latest data received while logged on.