CTERA Insight includes the following dashboards:
- Activity Analytics
- Activity Details
- File System Analytics - Last Week
- File System Analytics - Last Month
Refreshing the Display
Refreshing the Whole Dashboard
To refresh the whole dashboard or set the refresh frequency, click  in the top right corner and then click Refresh dashboard.
To set the refresh interval for a dashboard:
- Click in the top right corner of the dashboard.
- Click Set auto-refresh interval.
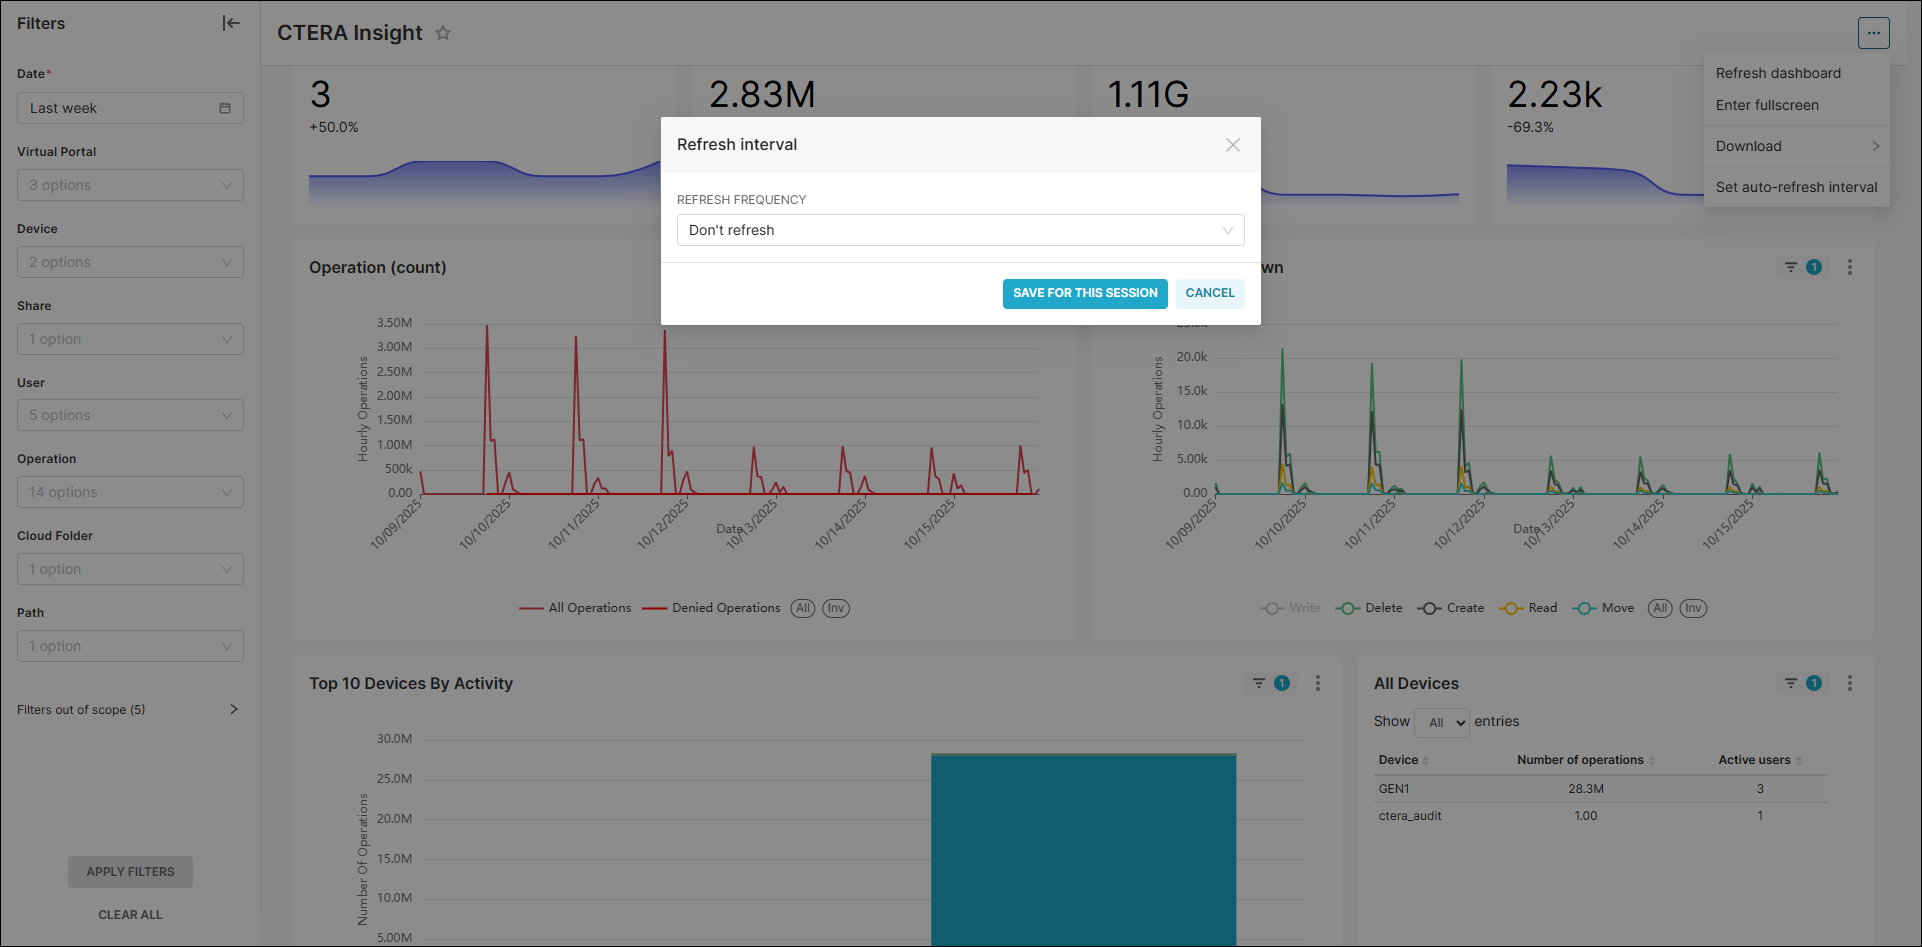
- Select the refresh interval from the drop-down and click SAVE FOR THIS SESSION.
Refreshing a Panel in a Dashboard
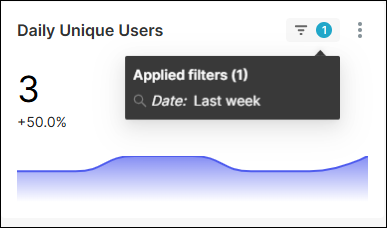
In the top right corner of each item in a dashboard the number of filter types that is being used in the display and the option to refresh the display.
Mouse over the filter number to display what filters are being used.
Click  to, for example, enable refreshing the display, display the item in full screen, or download the the panel.
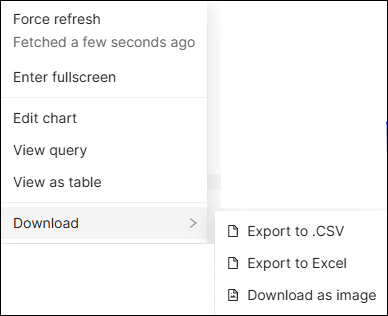
Click View as table to present the information over the date duration as a table.
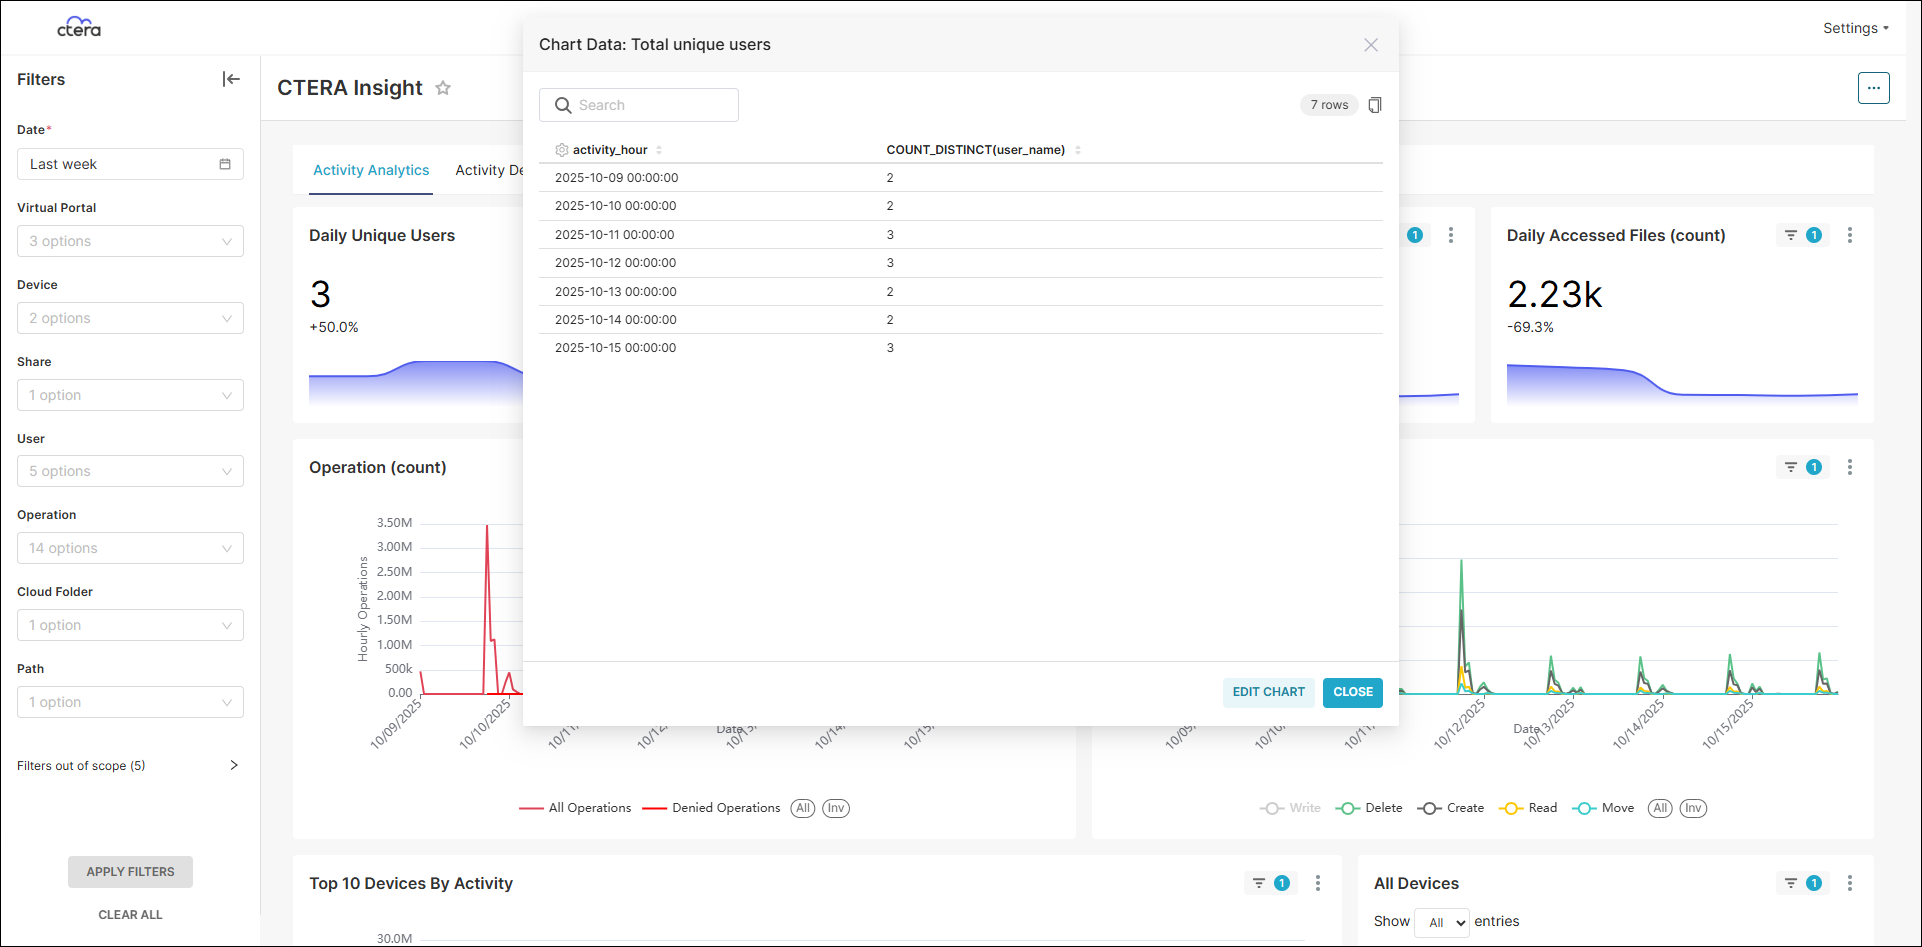
Click CLOSE to close the table.
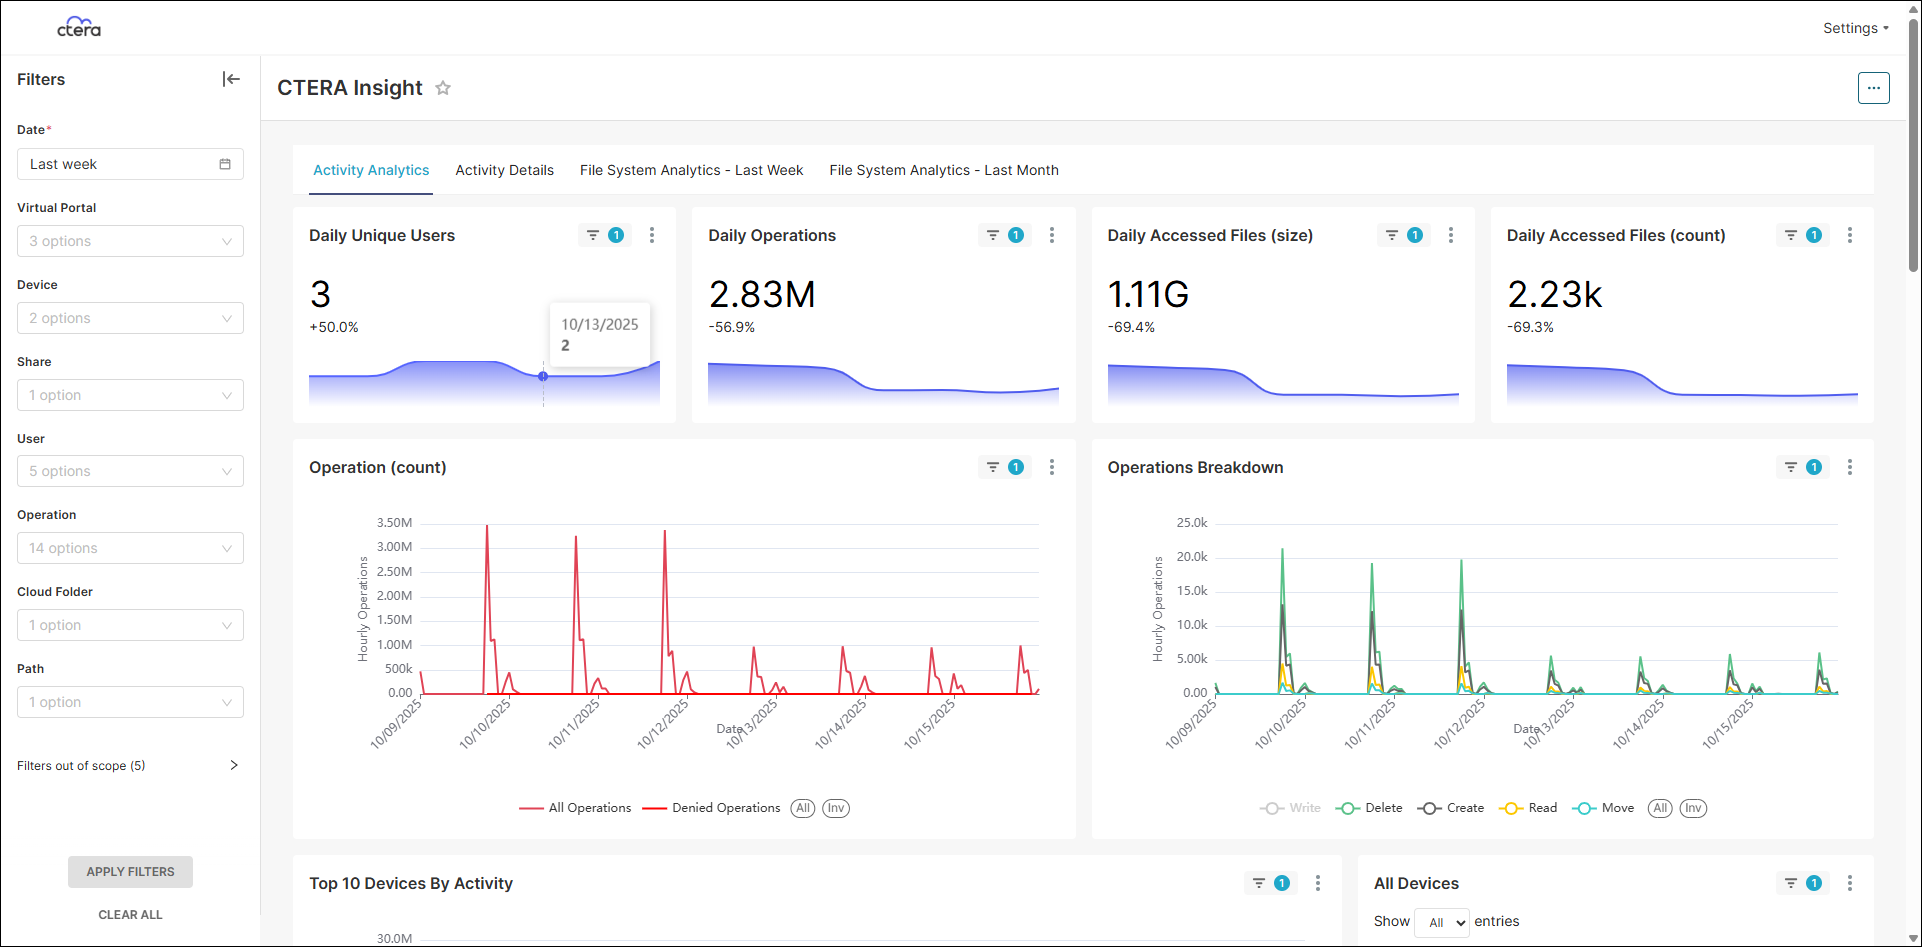
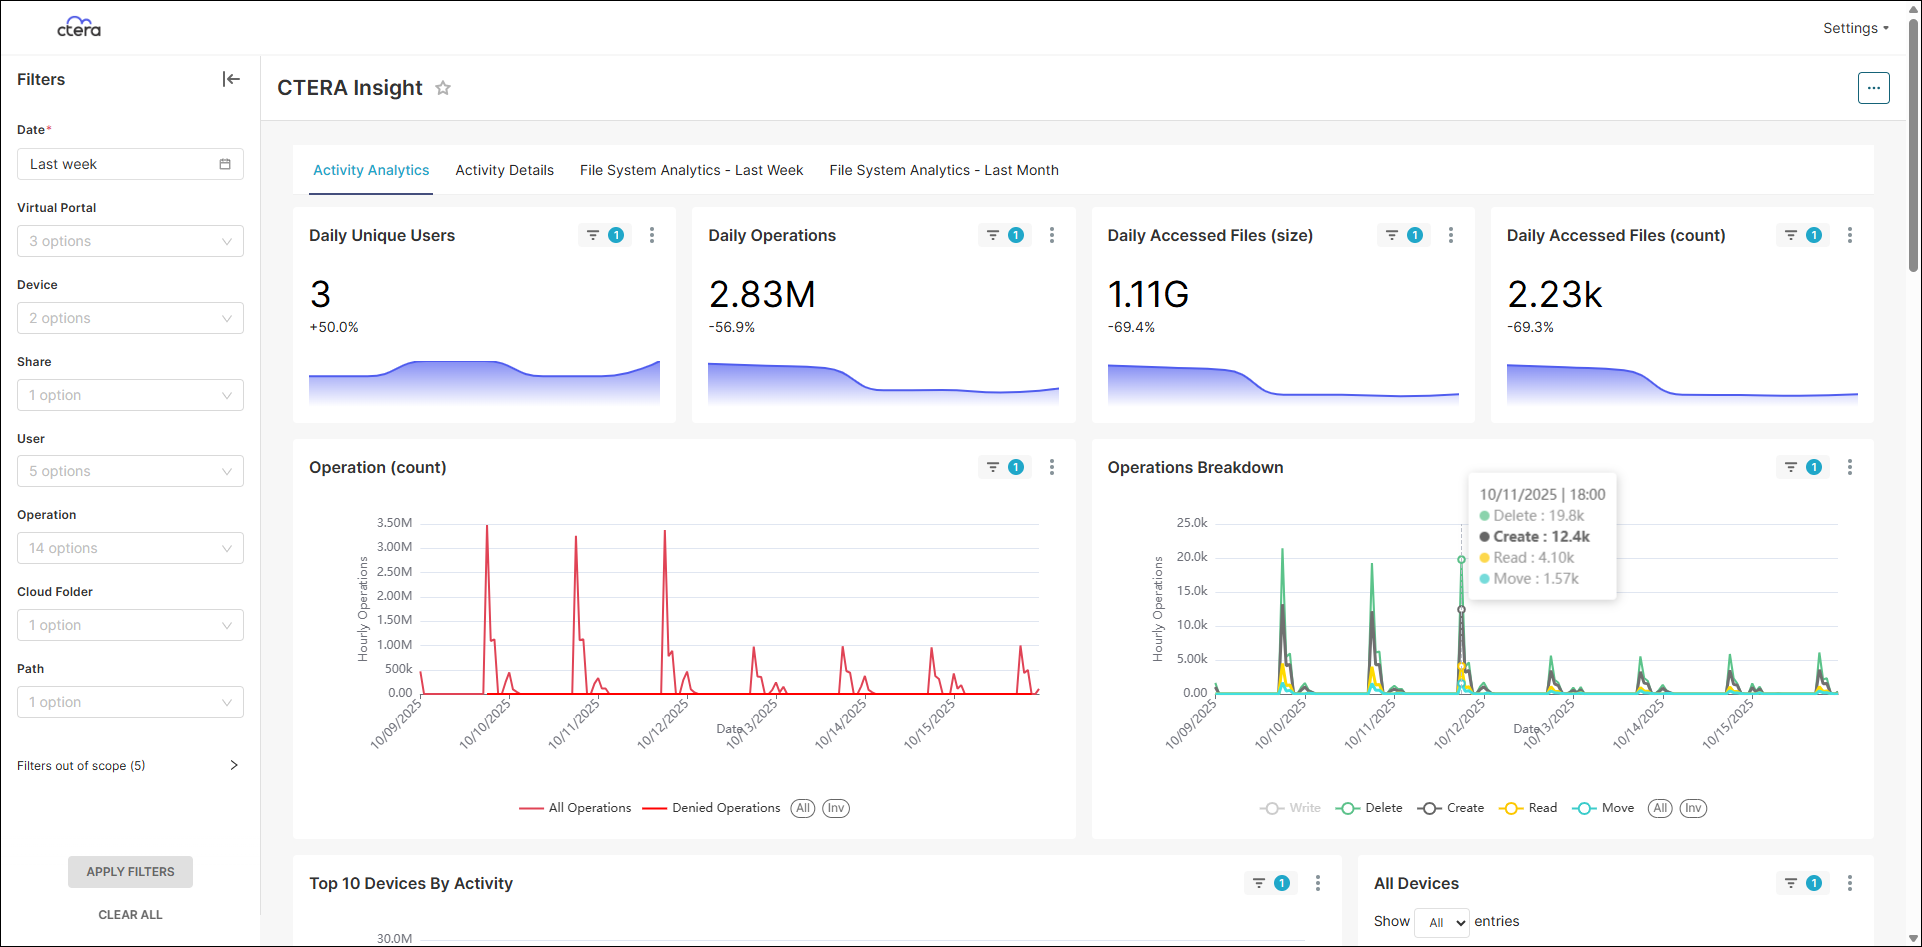
Mouse over a graph in the dashboard to display additional information about a specific point-in-time.
| Daily Operations Example | Operations Breakdown Example |
|---|---|
 |
 |
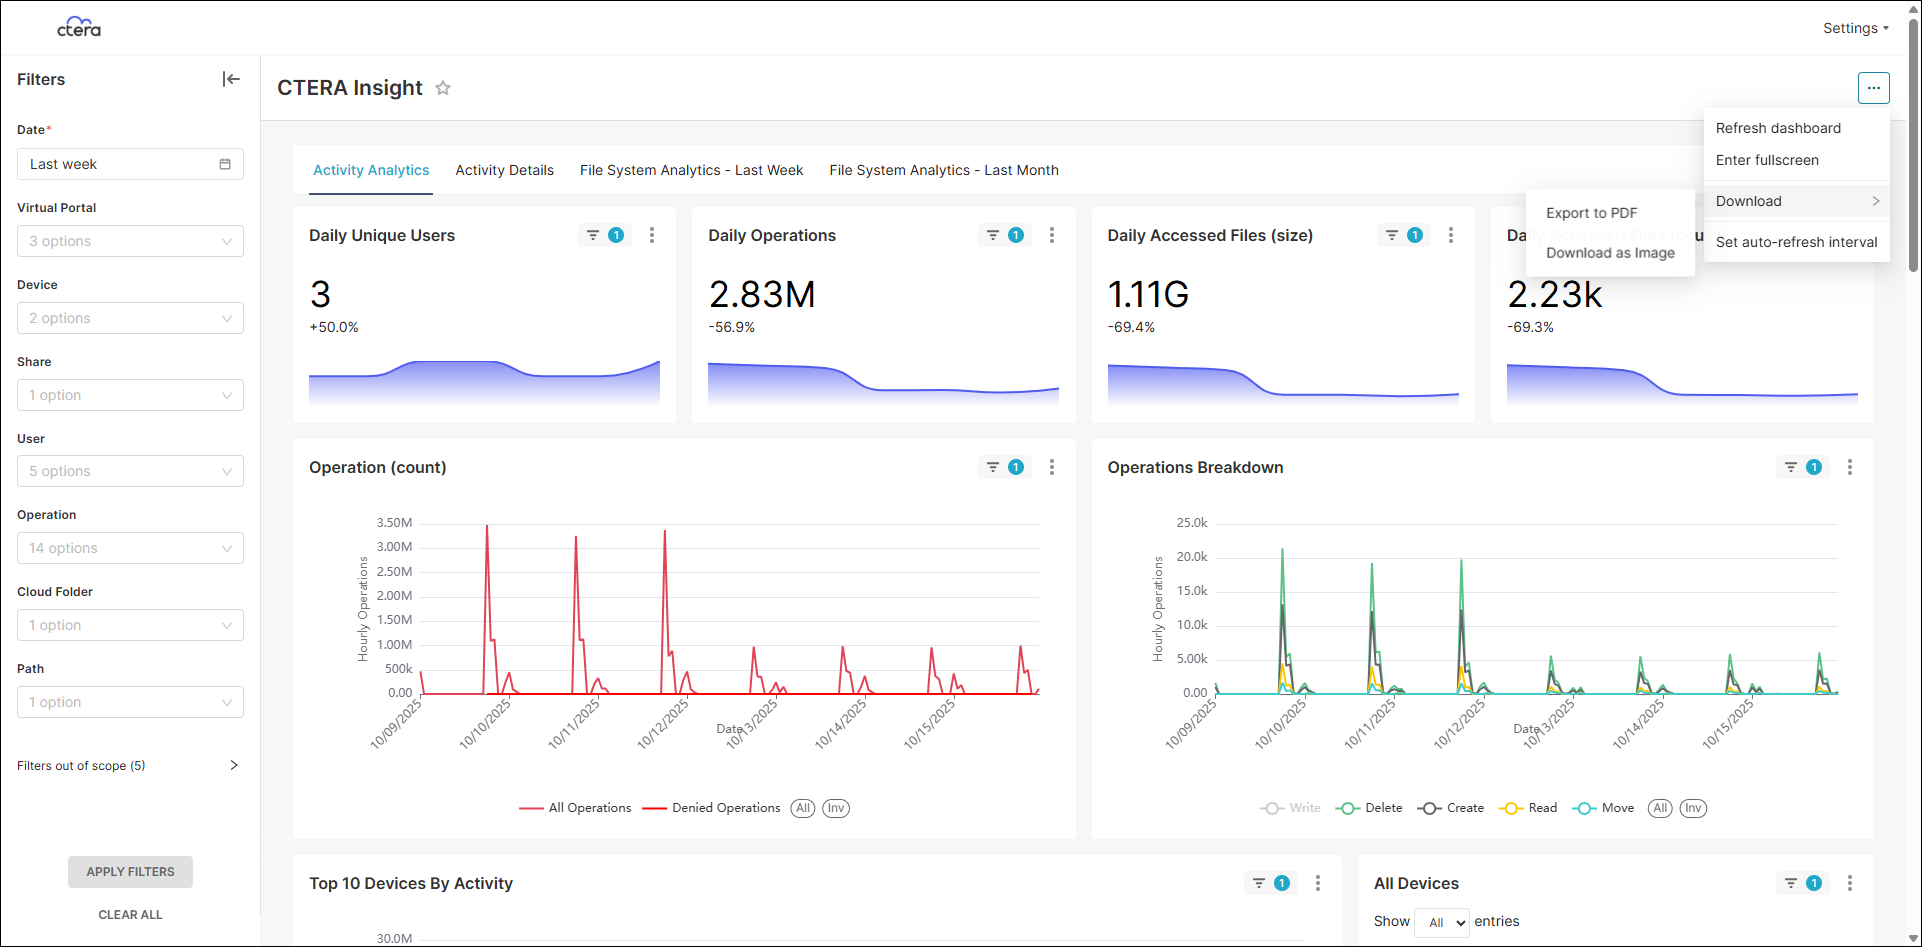
Downloading a Dashboard
You can download the dashboard either as a as a .pdf file or as a .jpg file.
To download a dashboard:
- Click in the top right corner of the dashboard.
- Click Download > Export to PDF to download the dashboard as a .pdf file or Download as Image to download the dashboard as a .jpg file.
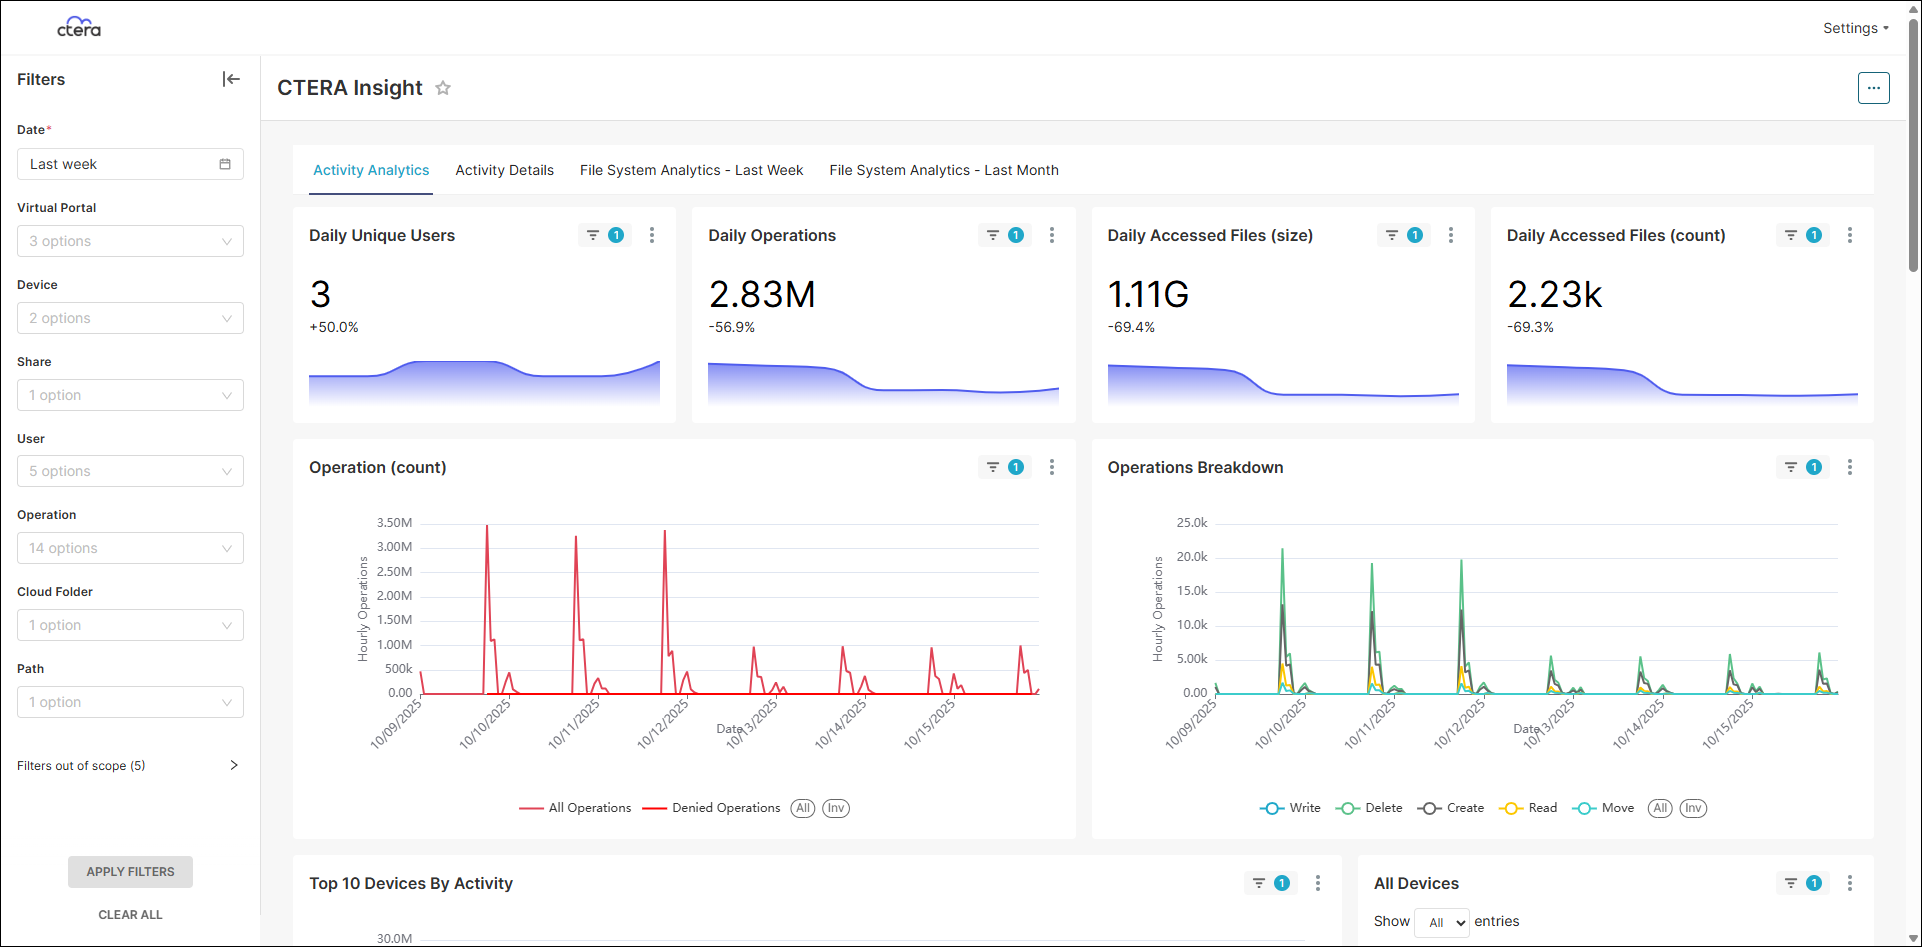
Activity Analytics
The Activity Analytics dashboard tracks the audit log history over the last 90 days to provide comprehensive visibility into user actions and system events: daily operations, file access patterns, user activities, and detailed breakdowns of events.
You use this information to make informed decisions based on real-time data.
Daily Unique Users – The daily number of users that performed auditable operations on edge filers that have auditing enabled.
Daily Operations – The daily number of auditable operations on edge filers that have auditing enabled.
Daily Accessed Files (size) – The size of all the files that were accessed for an auditable operation from edge filers that have auditing enabled per day.
Daily Accessed Files (count) – The daily number of files that were accessed for an auditable operation from edge filers that have auditing enabled.
Operation (count) – A graph of the operations performed and denied over the selected time period.
Operation Breakdown – A graph of all the auditable actions performed over the selected time period.
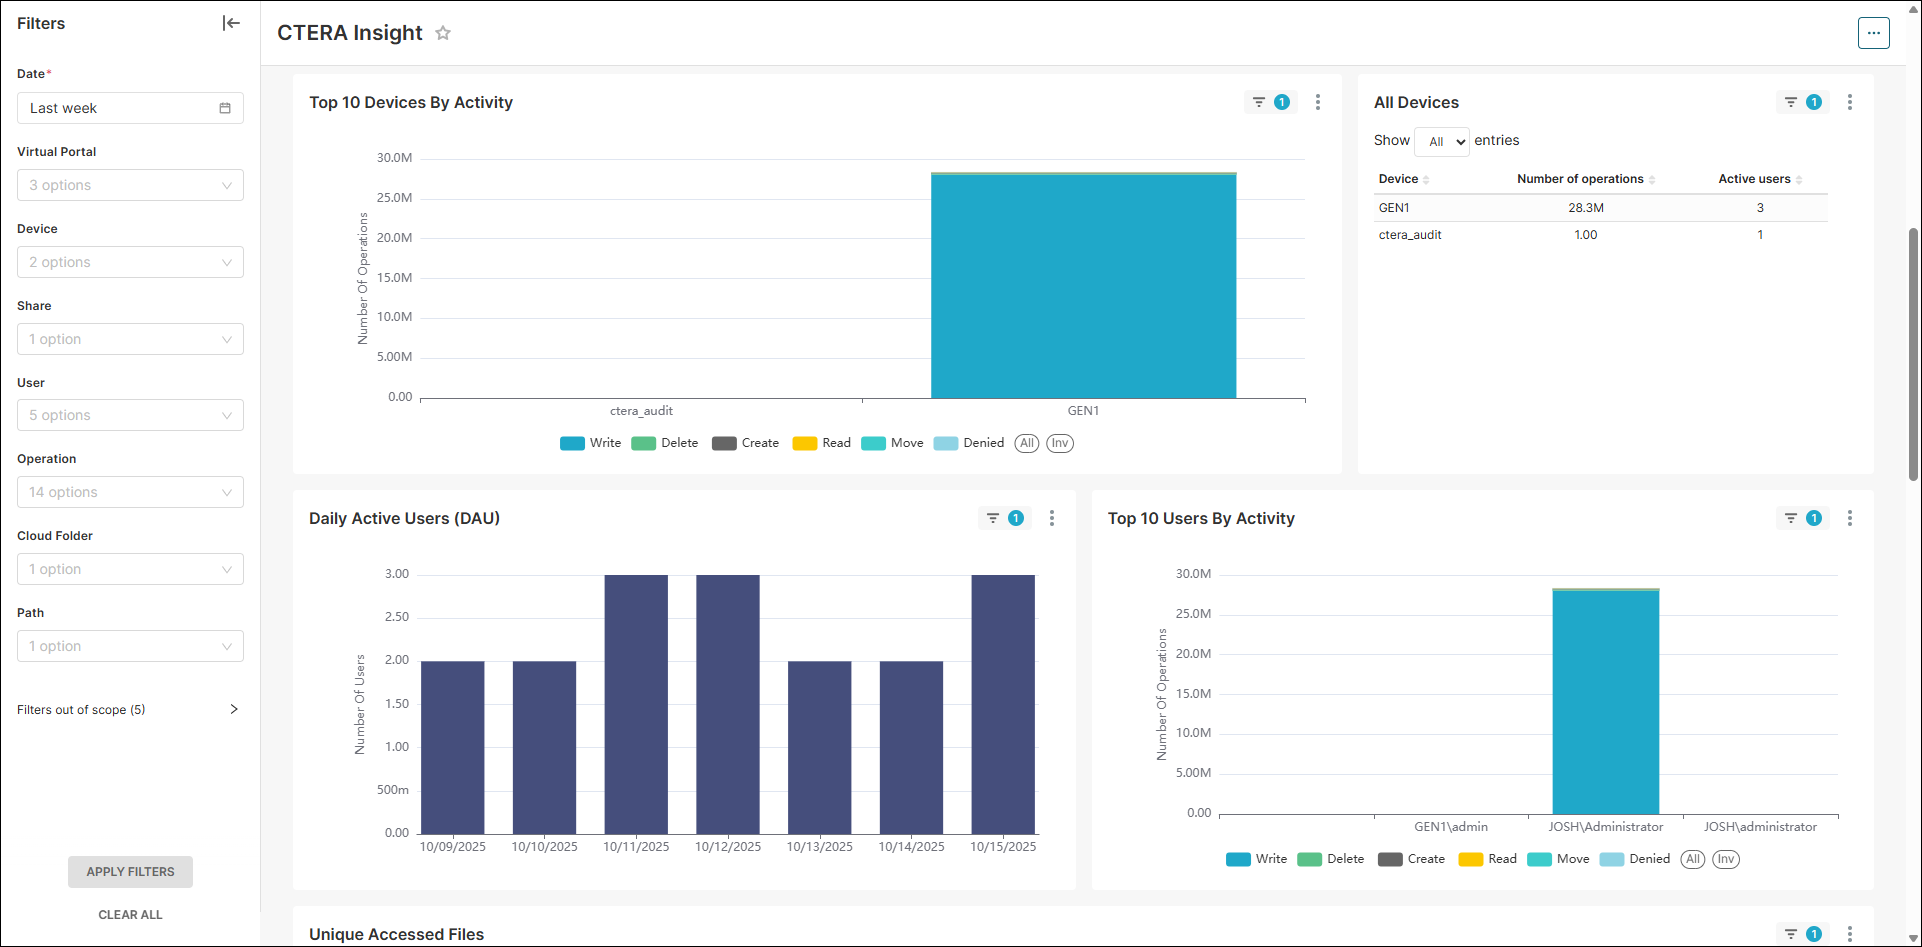
Top 10 Devices By Activity – The edge filers that have had the most auditable operations performed, broken down by the device and the operations on the device.
All Devices – The number of operations and the number of active users for the monitored edge filers.
Daily Active Users (DAU) – The number of unique users that engage with the edge filers per day.
Top 10 Users By Activity – The ten users who have performed the most operations.
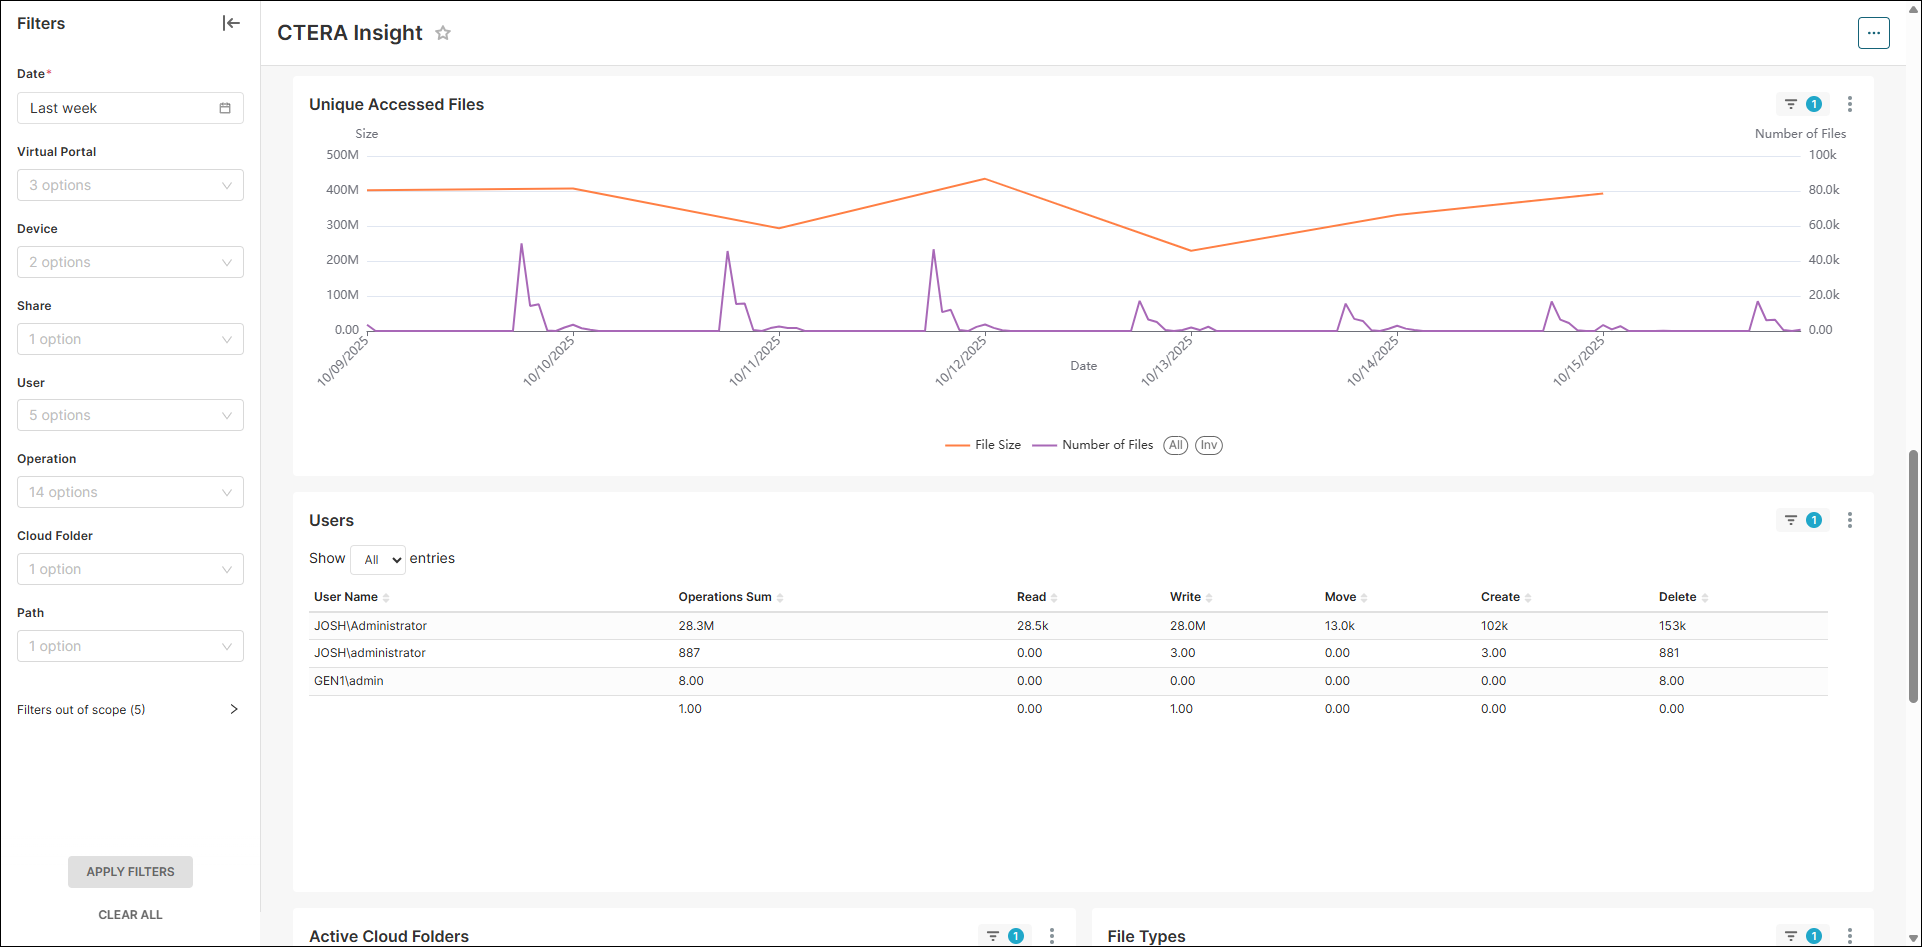
Unique Accessed Files – A graph showing the amount of storage and number of files accessed over time. This provides a better understanding of the hot data set at each edge location to adjust the caching sizes for each edge filer. When both the storage amount and file number is displayed, the graph shows the storage for all the files accessed at that point.
Users – Details of what operations were performed by each user.
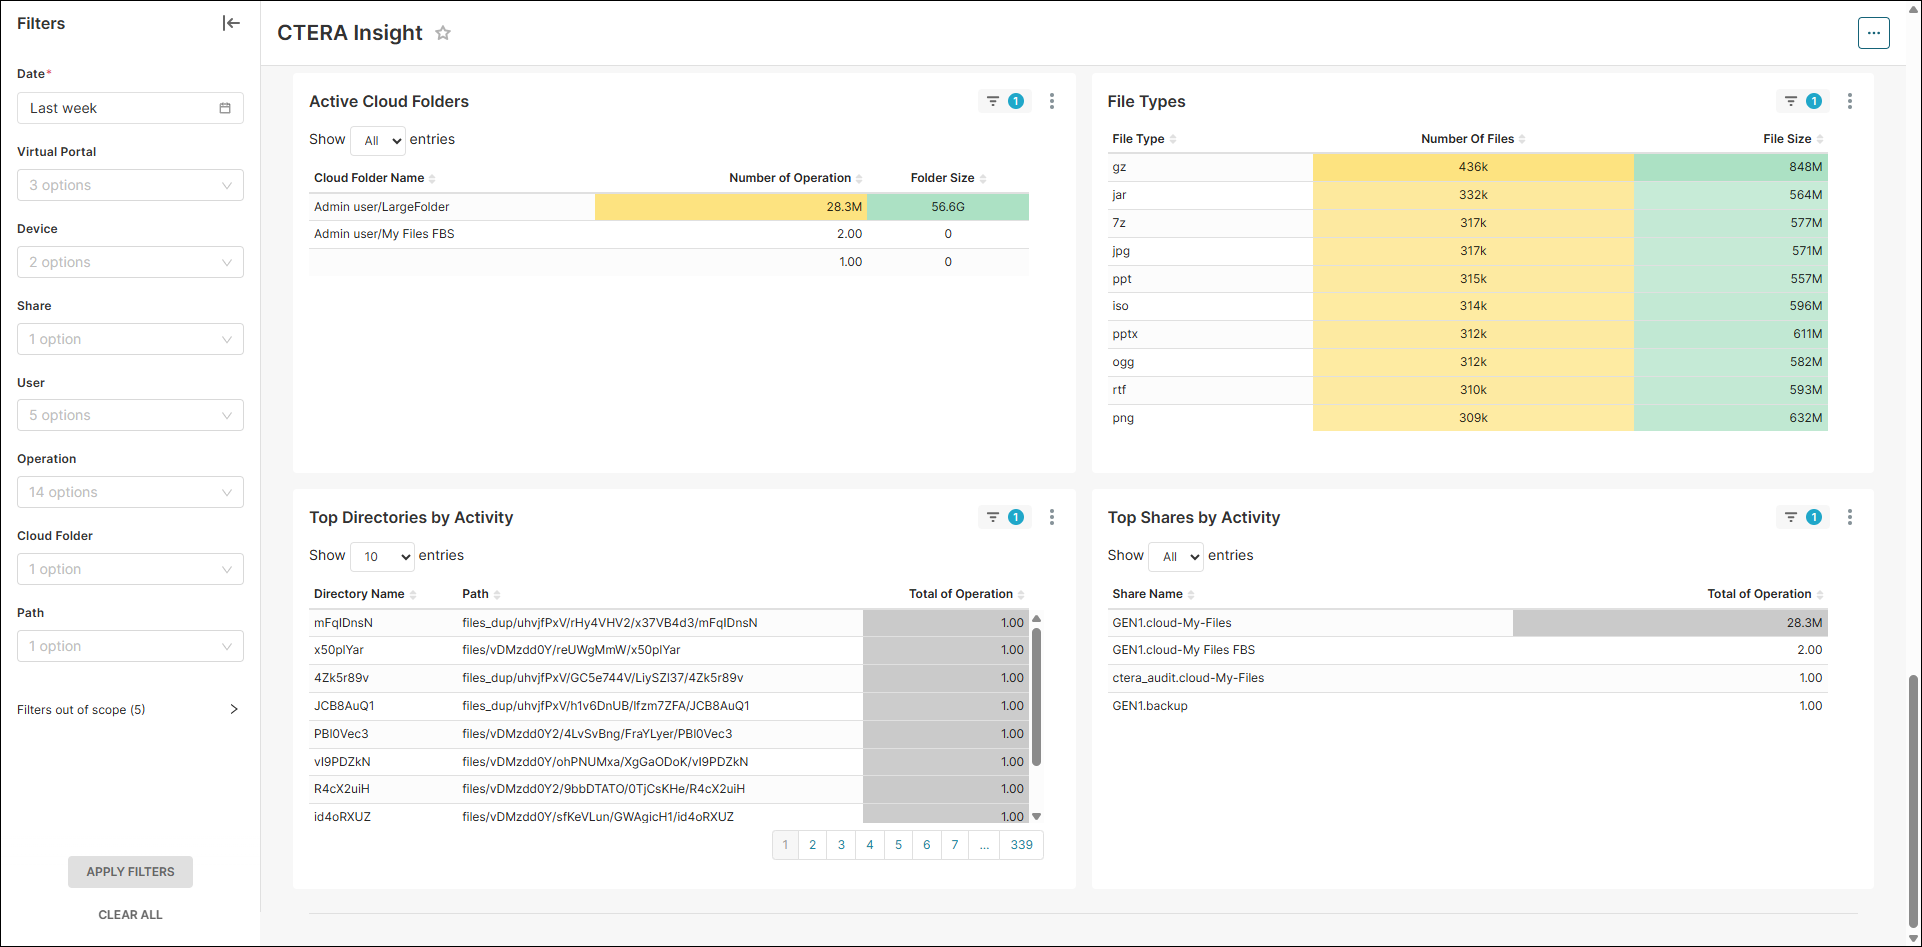
Active Cloud Folders – The cloud folders that have been accessed with the total number of operations performed on that cloud folder and the folder size.
Top File Types – The most common files types that have been accessed with the total number used and size of each file type.
Top Directories by Activity – The most commonly accessed directories with the total number of operations performed on that directory.
Top Shares by Activity – The most commonly accessed shares with the total number of operations performed on that directory.
Activity Details
The Activity Details dashboard displays the raw activity data, showing every audited operation on the file system.
Advanced search and filtering capabilities enable you to locate and analyze specific events or user activities within the audit logs.
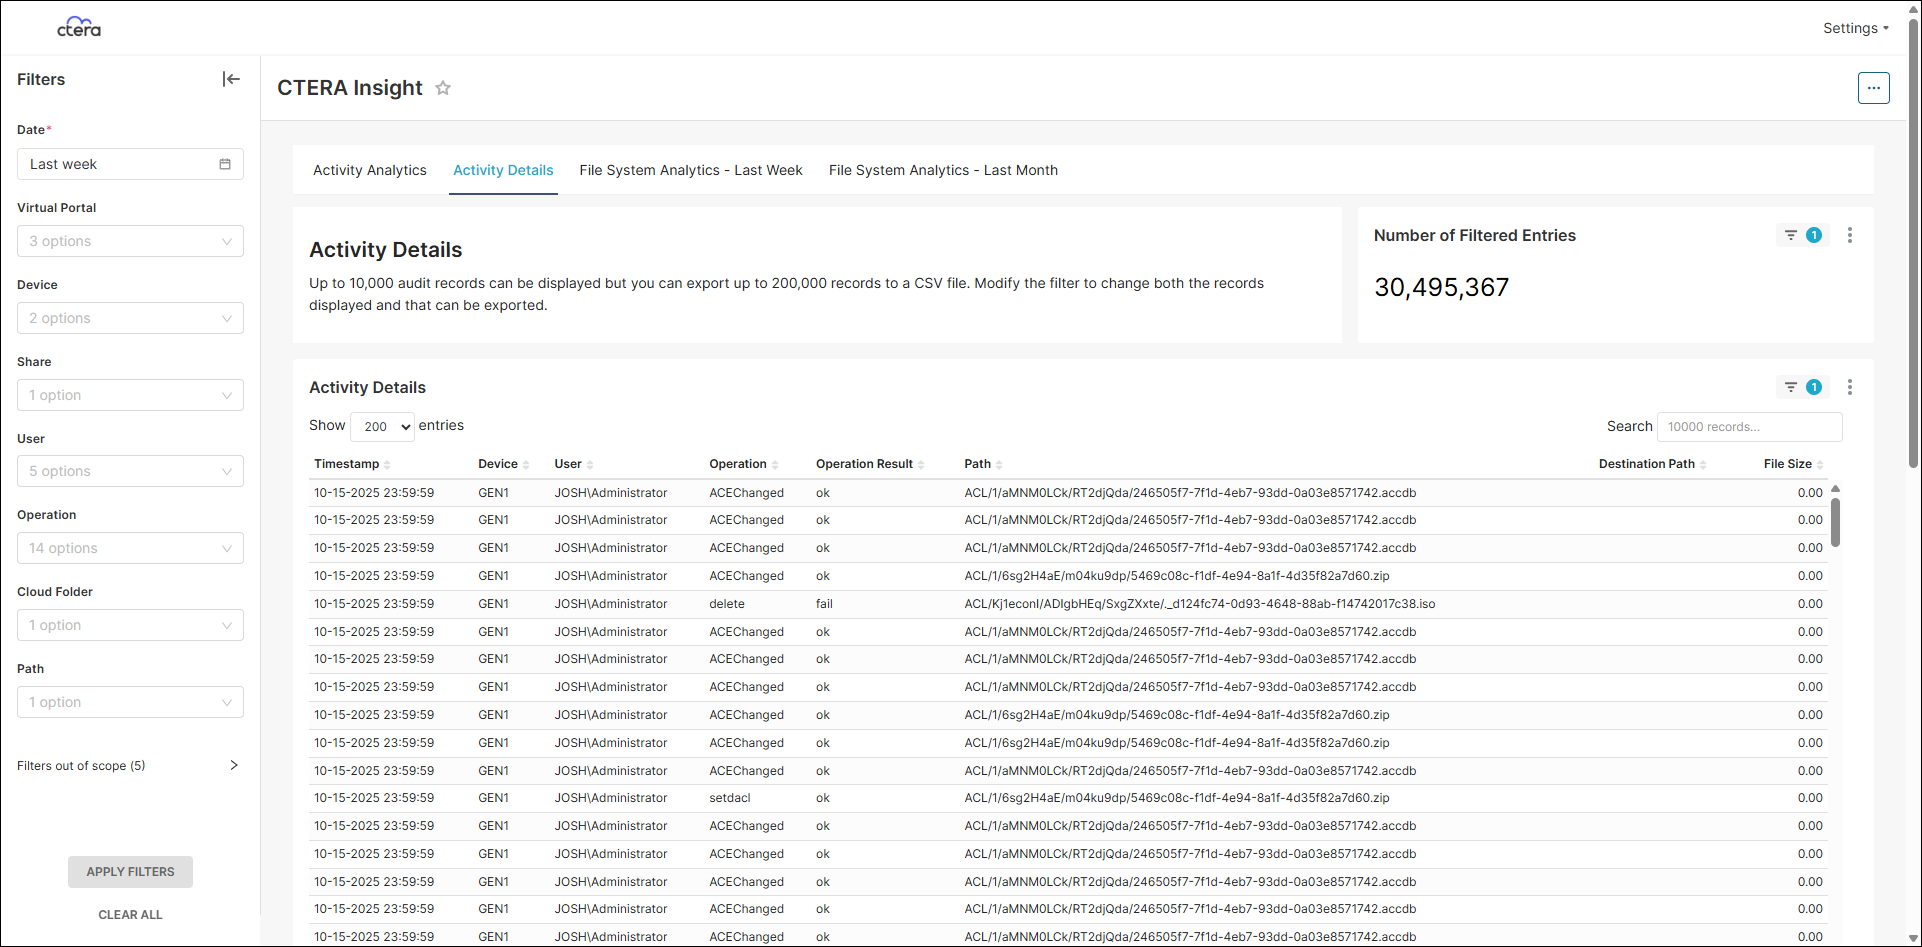
For example, you can find all the directories that were deleted by searching for the delete operation and then use the path data to check for the directories, as opposed to files, that were deleted.
The activity of each monitored device, including the timestamp for each operation along with the user who performed the operation, the actual operation and whether the operation was successful or not. The source path and size for file operation is displayed and where relevant the destination path, for example for a move operation.
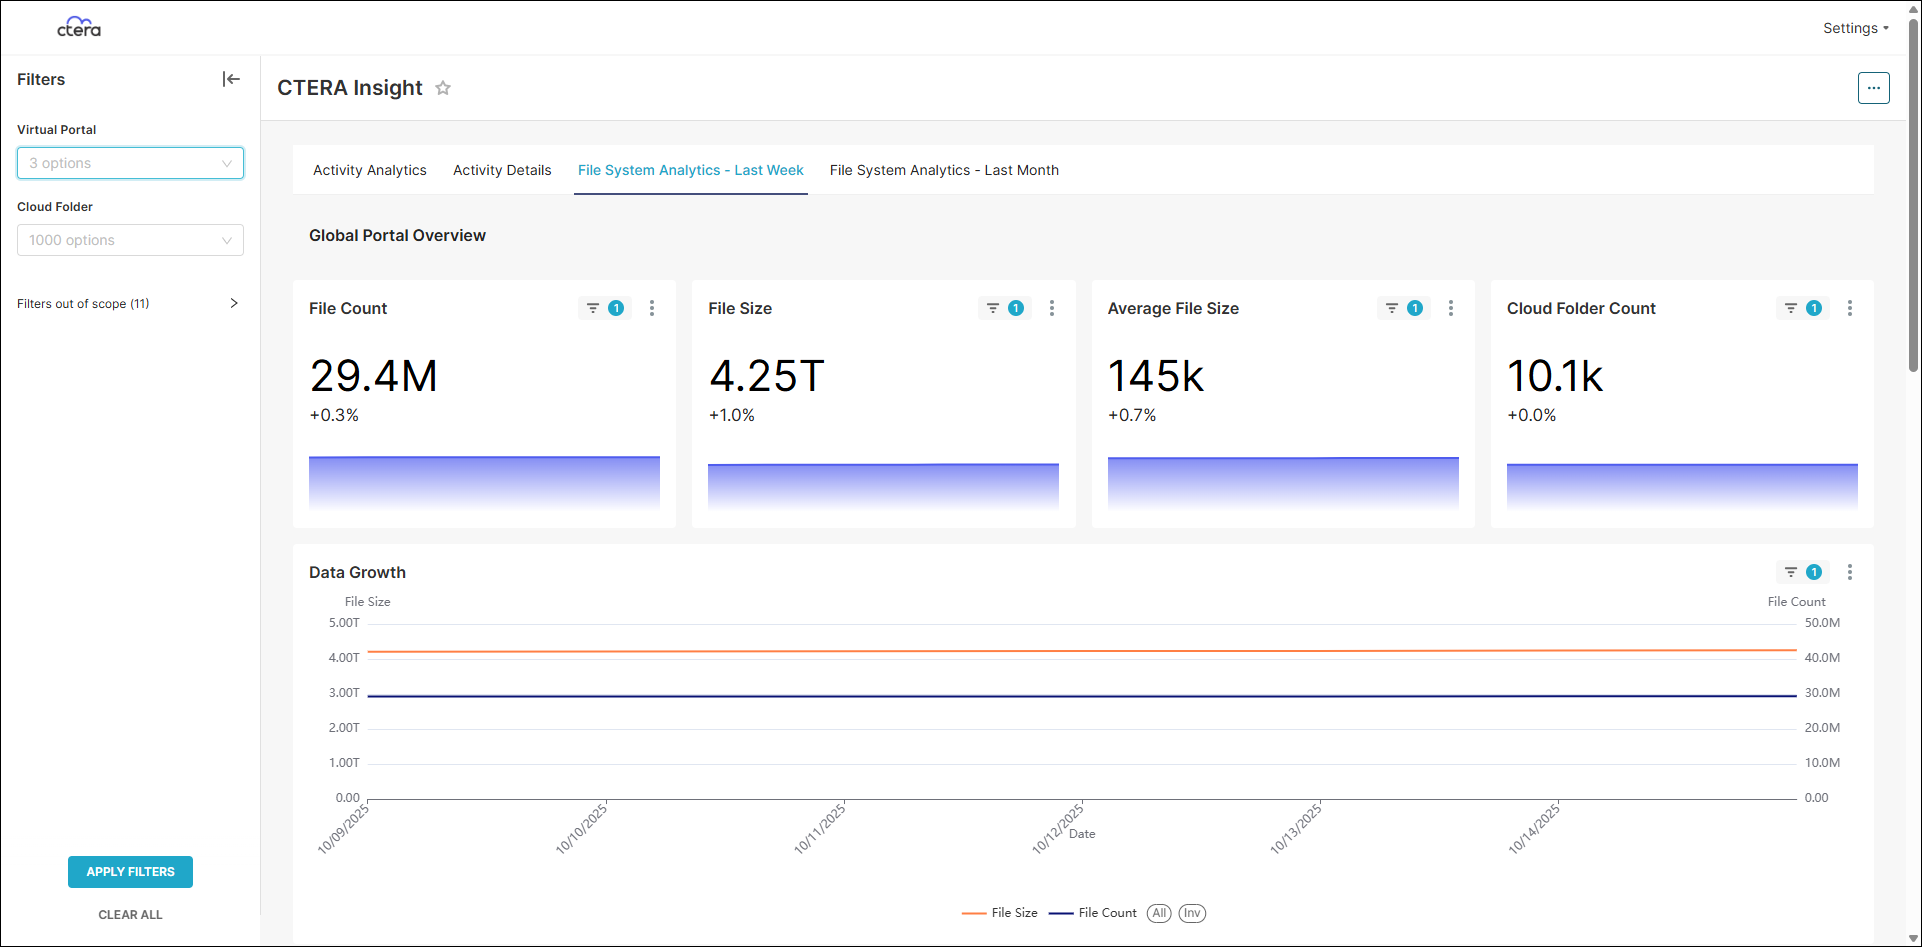
File System Analytics - Last Week/File System Analytics - Last Month
The File System Analytics - Last Week and File System Analytics - Last Month dashboards provide detailed insights on portal file system usage, storage capacity, and data growth trends over the past week or month.
A global administrator sees the information for all the team portals and can filter the dashboards by team portal. A team administrator sees only information about that team portal.
Using these dashboards any anomalies to data growth can be investigated down to the directory level. This enables informed resource allocation and optimization strategies.
| Last Week | Last Month |
|---|---|
 |
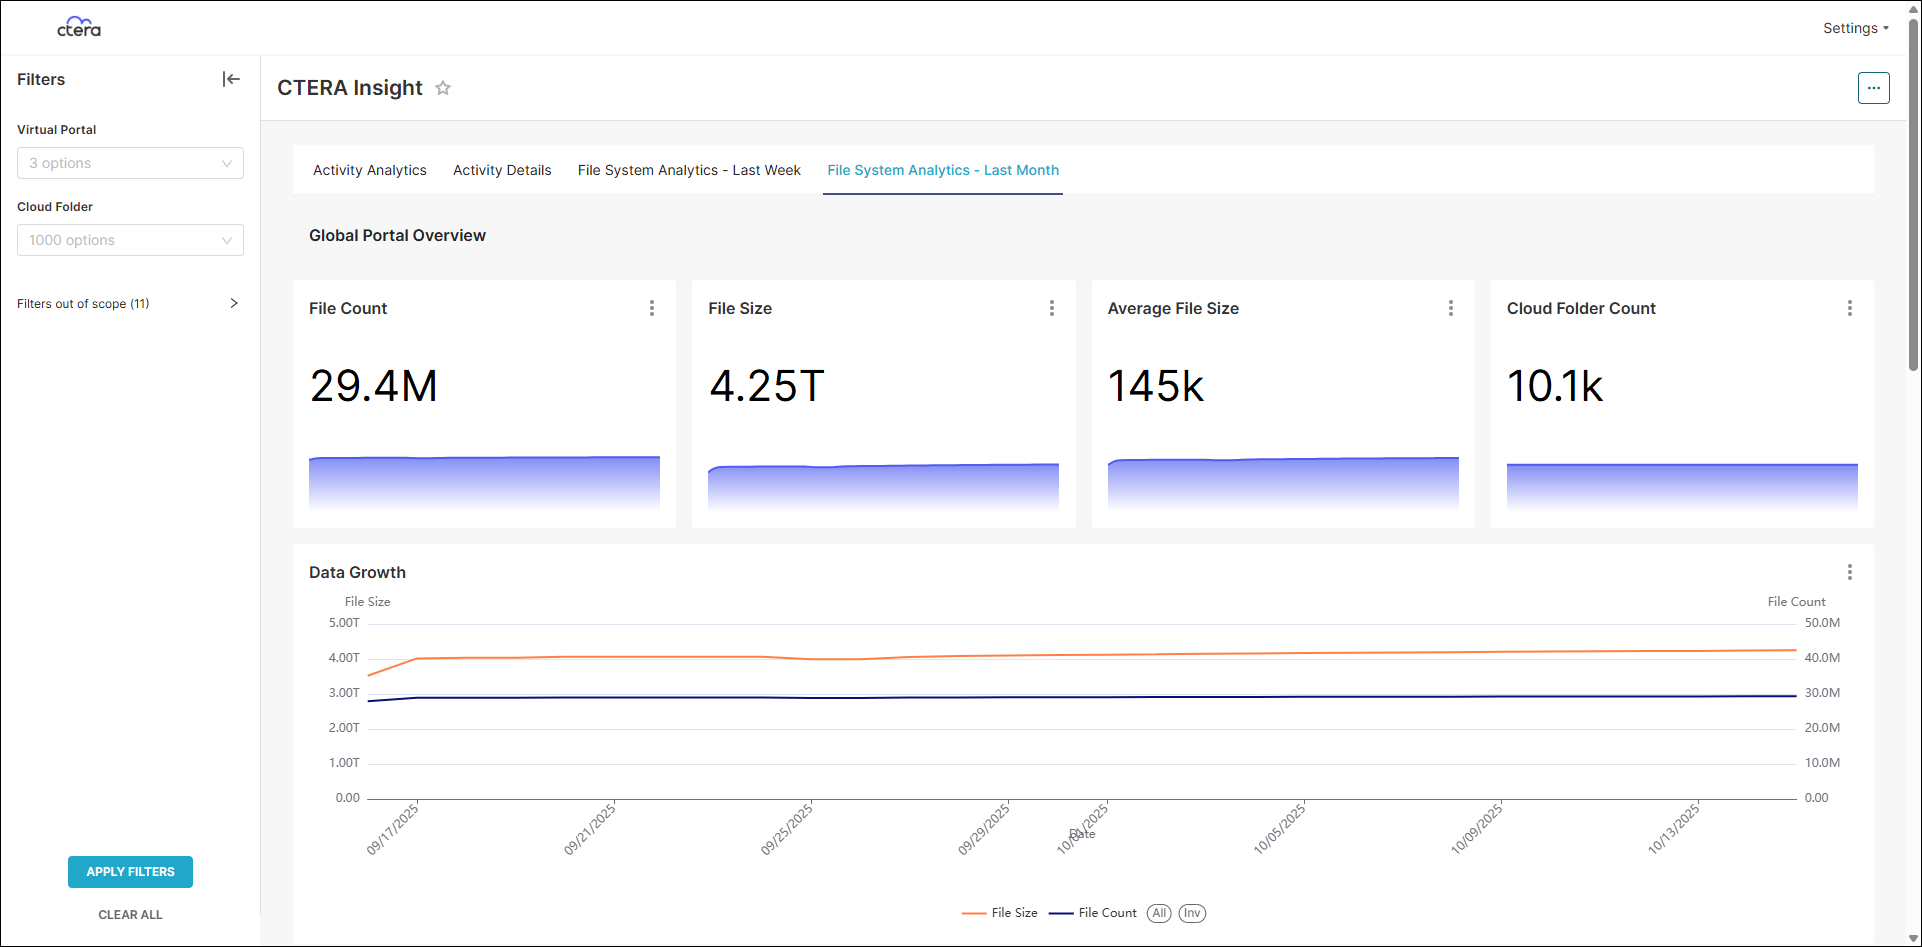 |
Global Portal Overview
The Global Portal Overview information is used by the global administrator for all the portals and by the team administrator for that specific team portal to get an overview of the file system and storage.
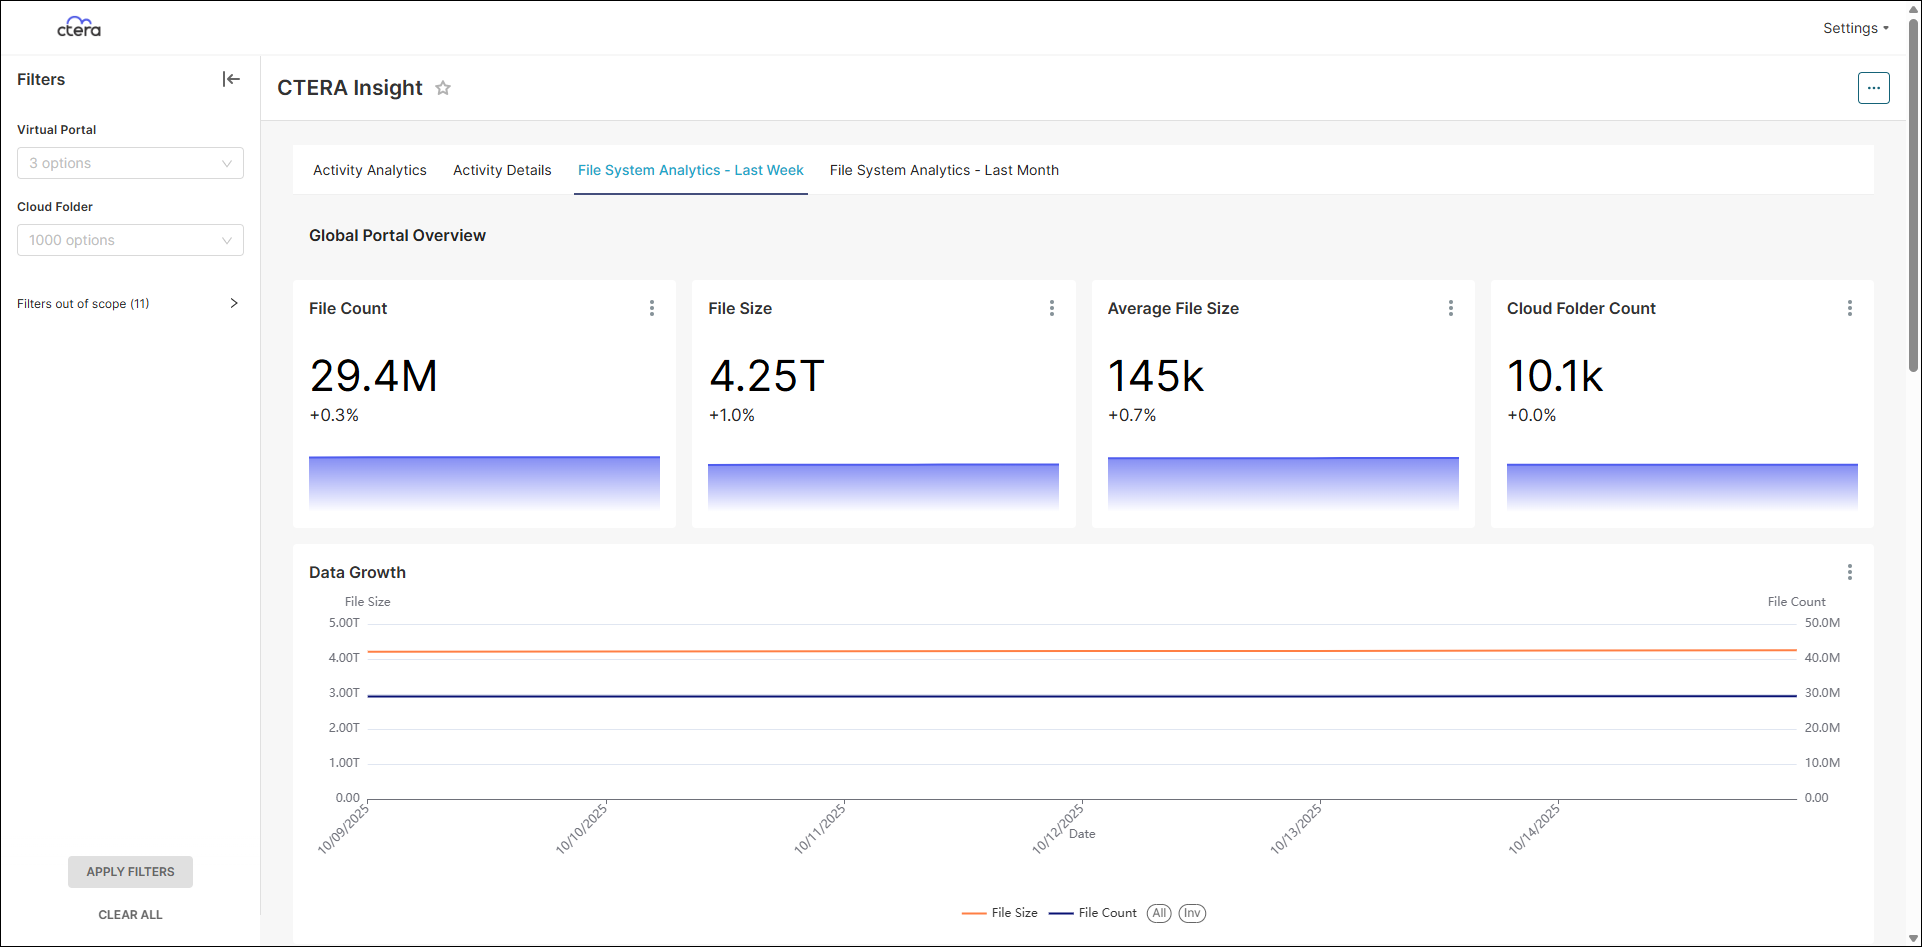
File Count – The number of files over the past week or month.
File Size – The storage allocated for the files over the last week or month.
Average File Size – The average file size over the last week or month.
Cloud Folder Count – The number of cloud folders over the past week or month.
Data Growth – A graph showing the growth over the last week or month of both the file size and file count.
Growth Detection
The Growth Detection information is used by the global administrator for all the portals and by the team administrator for that specific team portal to monitor storage usage.
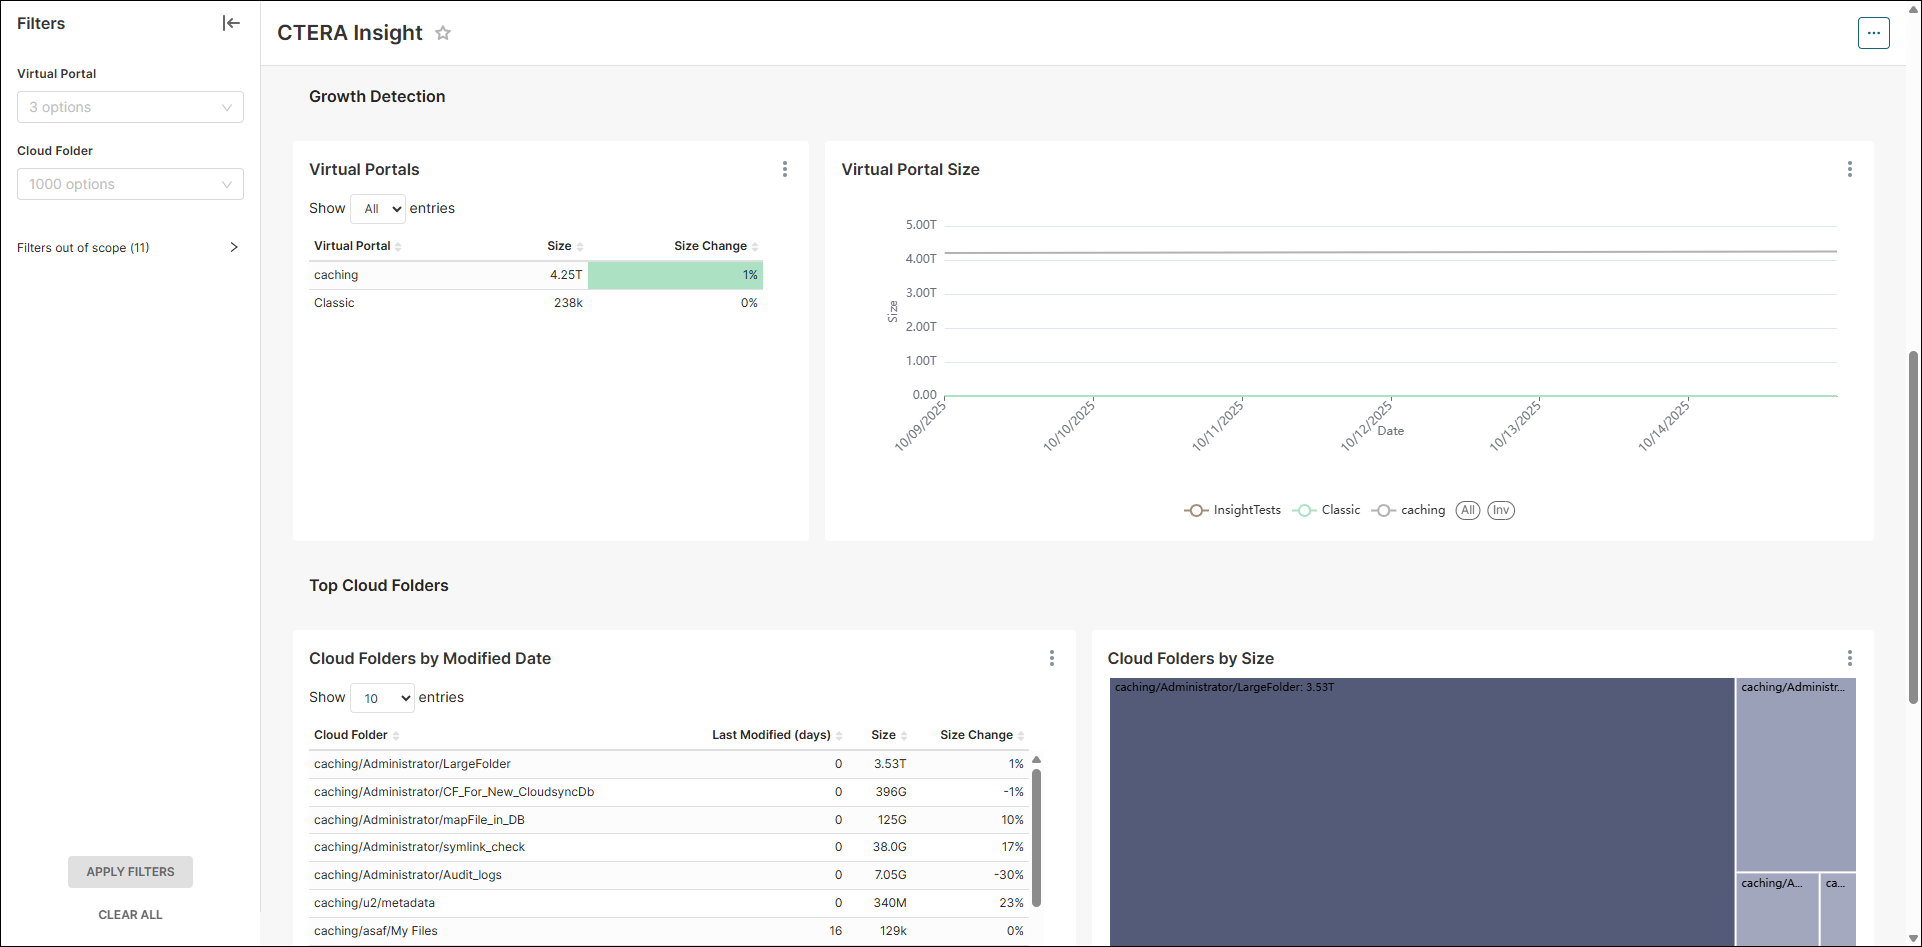
Virtual Portals – When logged in to CTERA Insight as a global administrator you can see the size and the week-on-week percentage change of each team portal in the CTERA Portal.
Virtual Portal Size – A graph showing each team portal size over time.
Top Cloud Folders
The Top Cloud Folders information is used by the global administrator for all the portals and by the team administrator for that specific team portal to monitor what cloud folders are used, based on the modification dates and cloud folder storage.
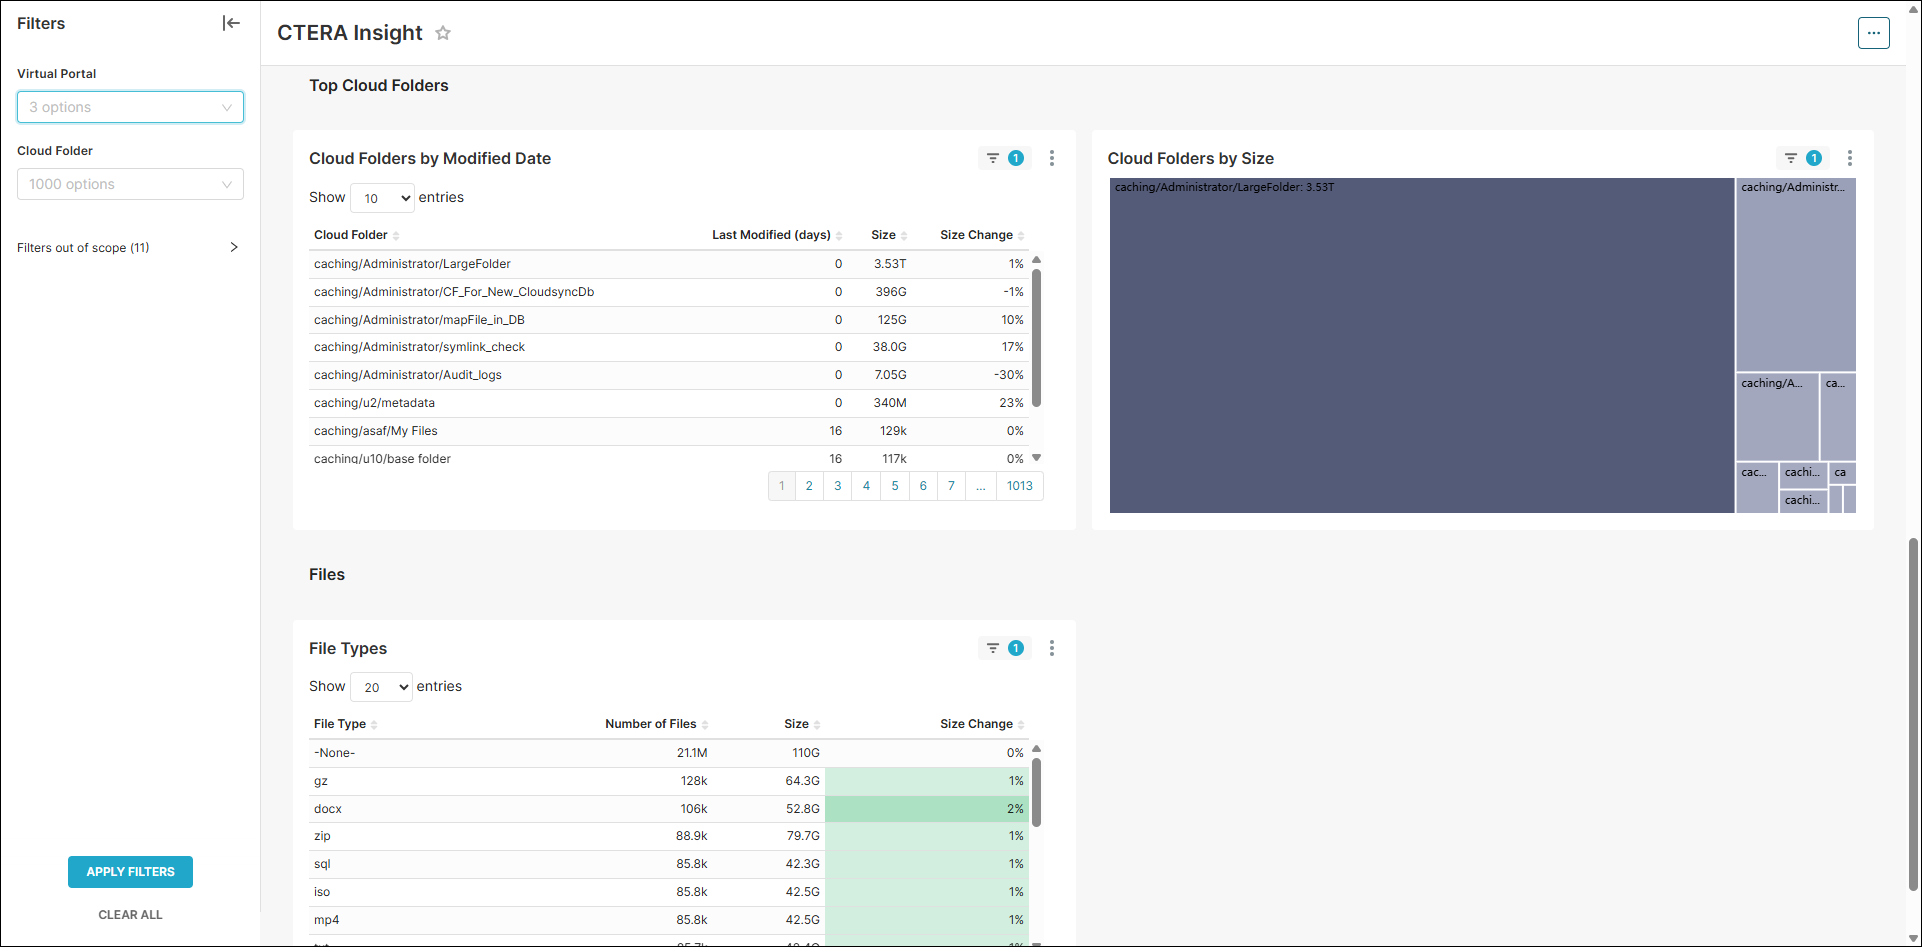
Cloud Folders by Modified Date – The cloud folders listed by when they were last modified.
Cloud Folders by Size – A representation of the whole storage broken down by size used by each cloud folder.
Files
The Files information is used by the global administrator for all the portals and by the team administrator for that specific team portal to monitor what are the common file types that are used, such as Microsoft O365 files or Adobe PDF files or graphic files, are used, and the storage used by these file types.
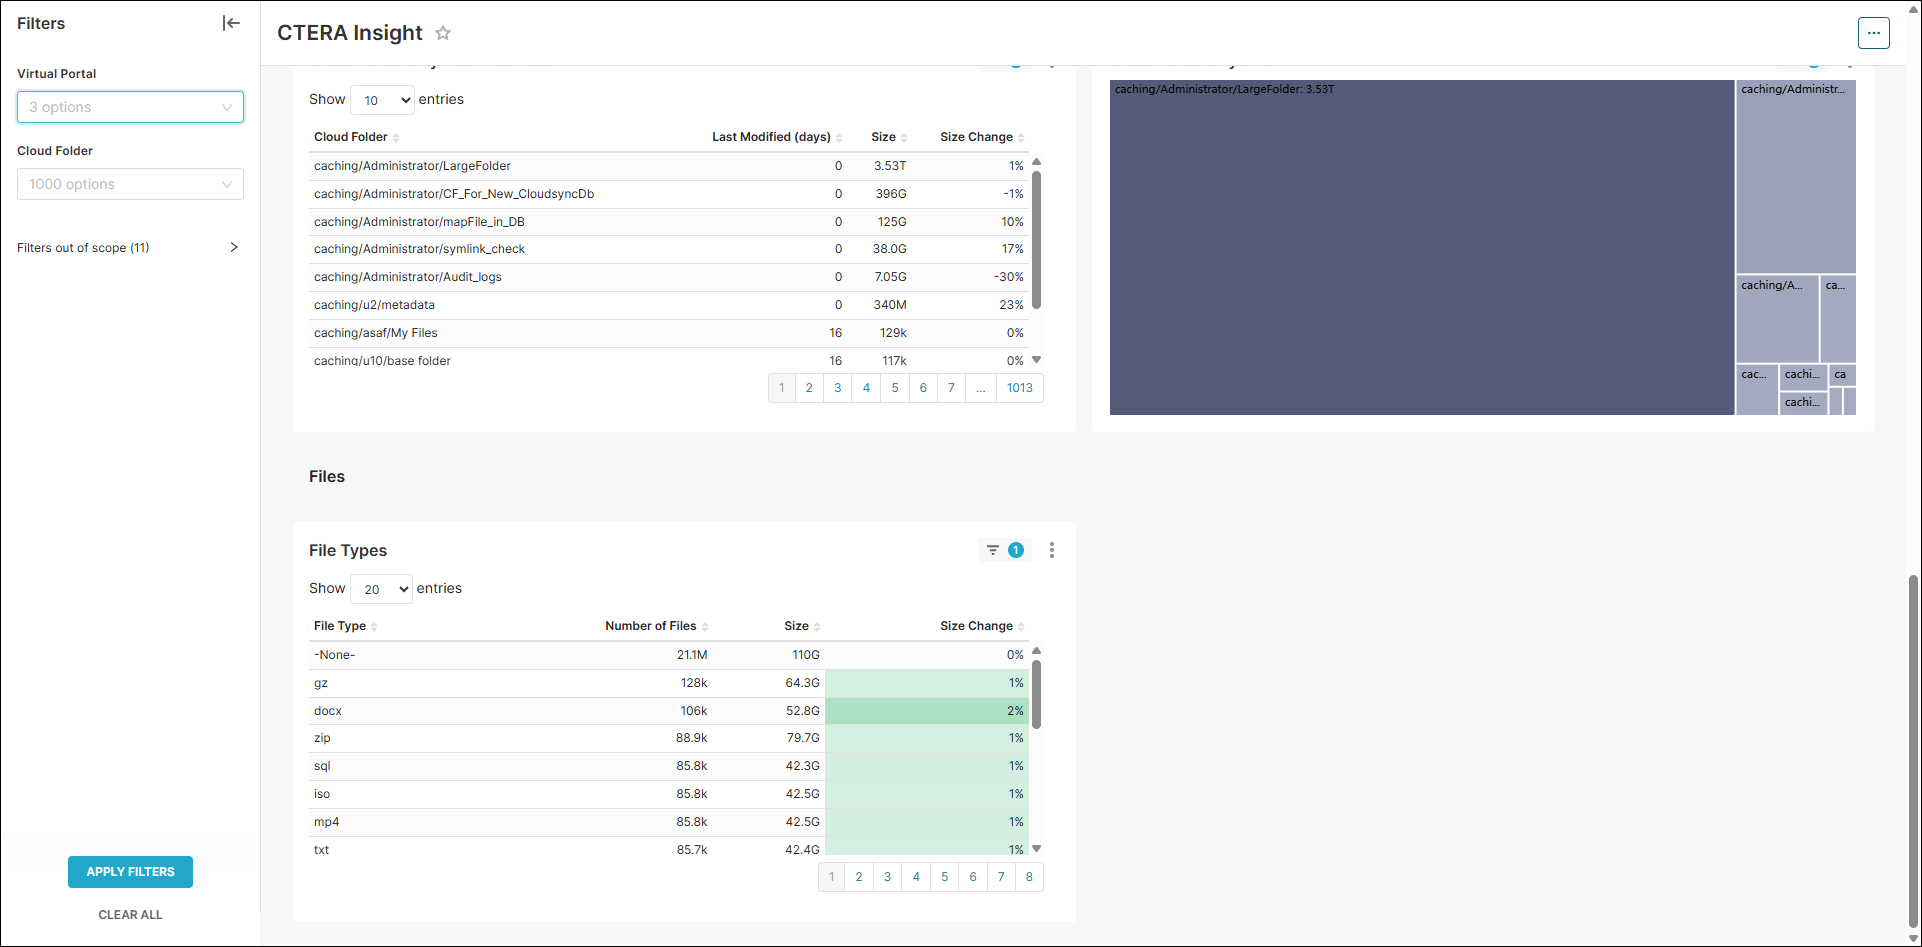
File Types – The number of files listed by their types with the amount of storage used for each file type.