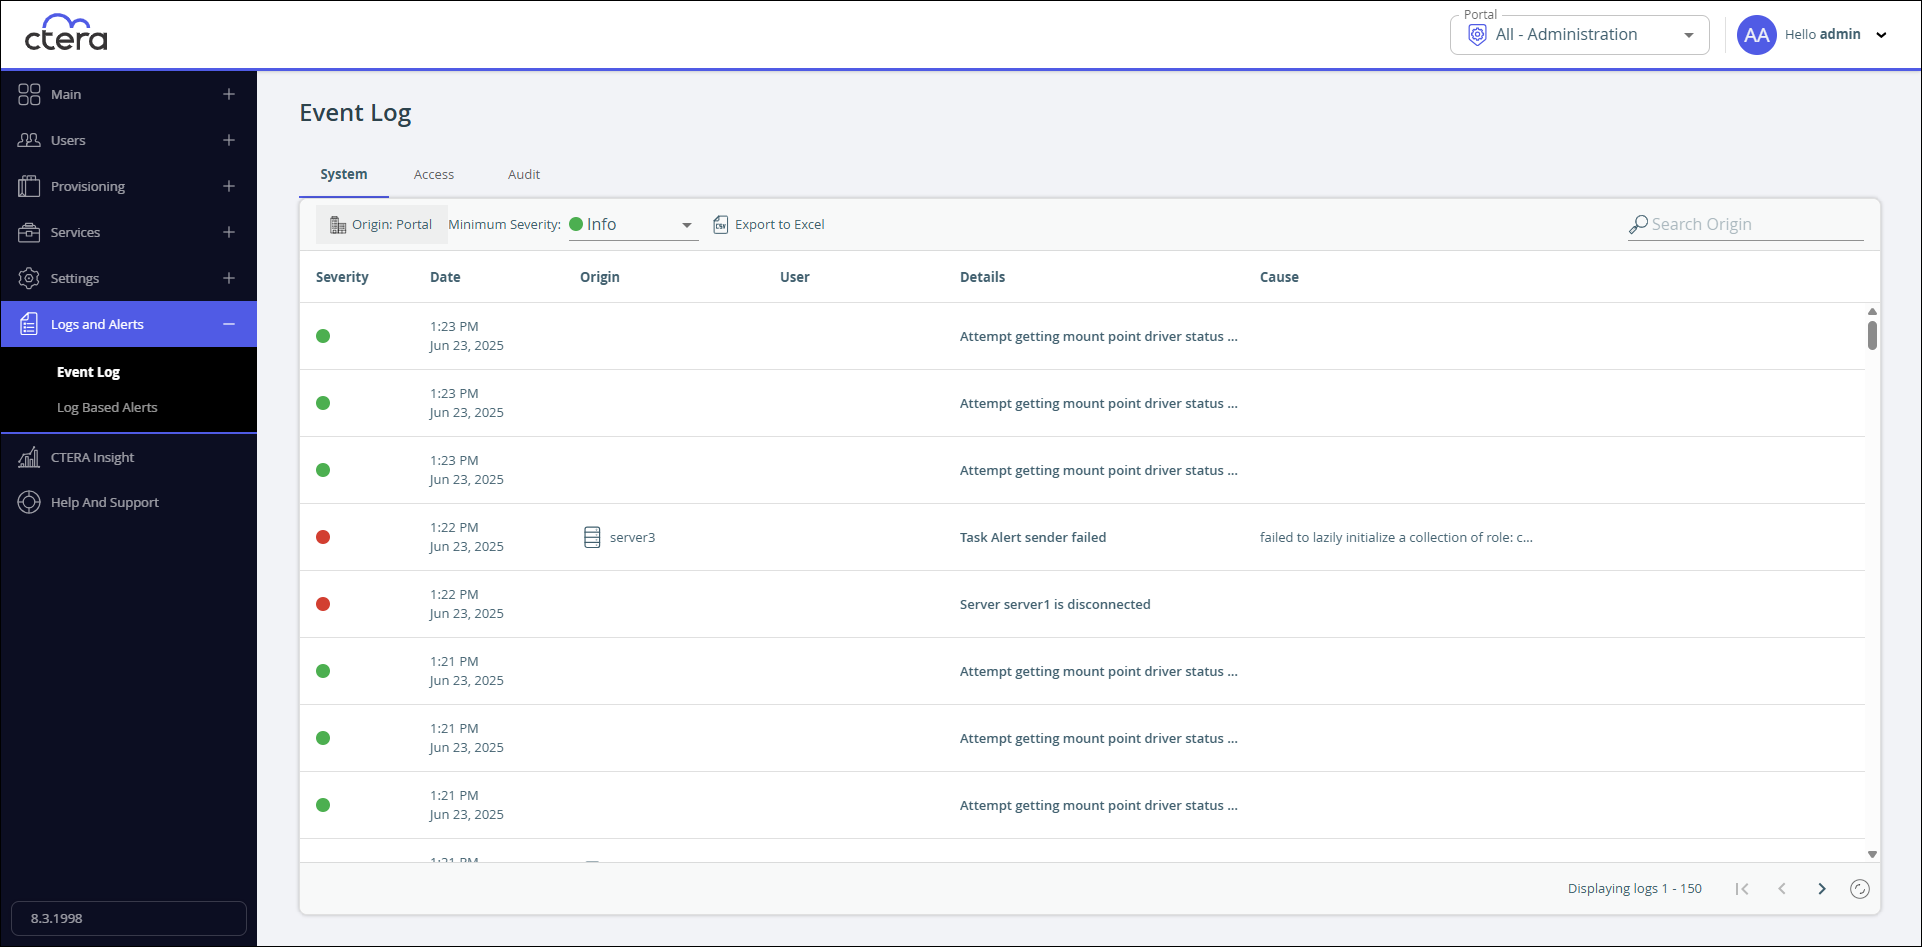
In the global administration view, select Logs and Alerts > Event Log in the navigation pane.
The Event Log page opens, displaying the system log and tabs for the Access and Audit logs.

The log information can be filtered by:
- The log origin: portal, device or both portal and device.
- The minimum severity: Debug, Info, Warning, Error.
The System Log
To view the system log:
- In the global administration view, select Logs and Alerts > Event Log in the navigation pane.
The Event Log page is displayed.

The page includes the following columns:
| Field | Display |
|---|---|
| Severity | The severity of the event represented by an icon. Green for OK, Orange for warning and Red for error. |
| Date | The date and time at which the event occurred. |
| Origin | The entity that sent the log entry. |
| User | The user who triggered the event. To view details about the user, click the user name. |
| Details | A description of the event. |
| Cause | A possible cause for the entry. |
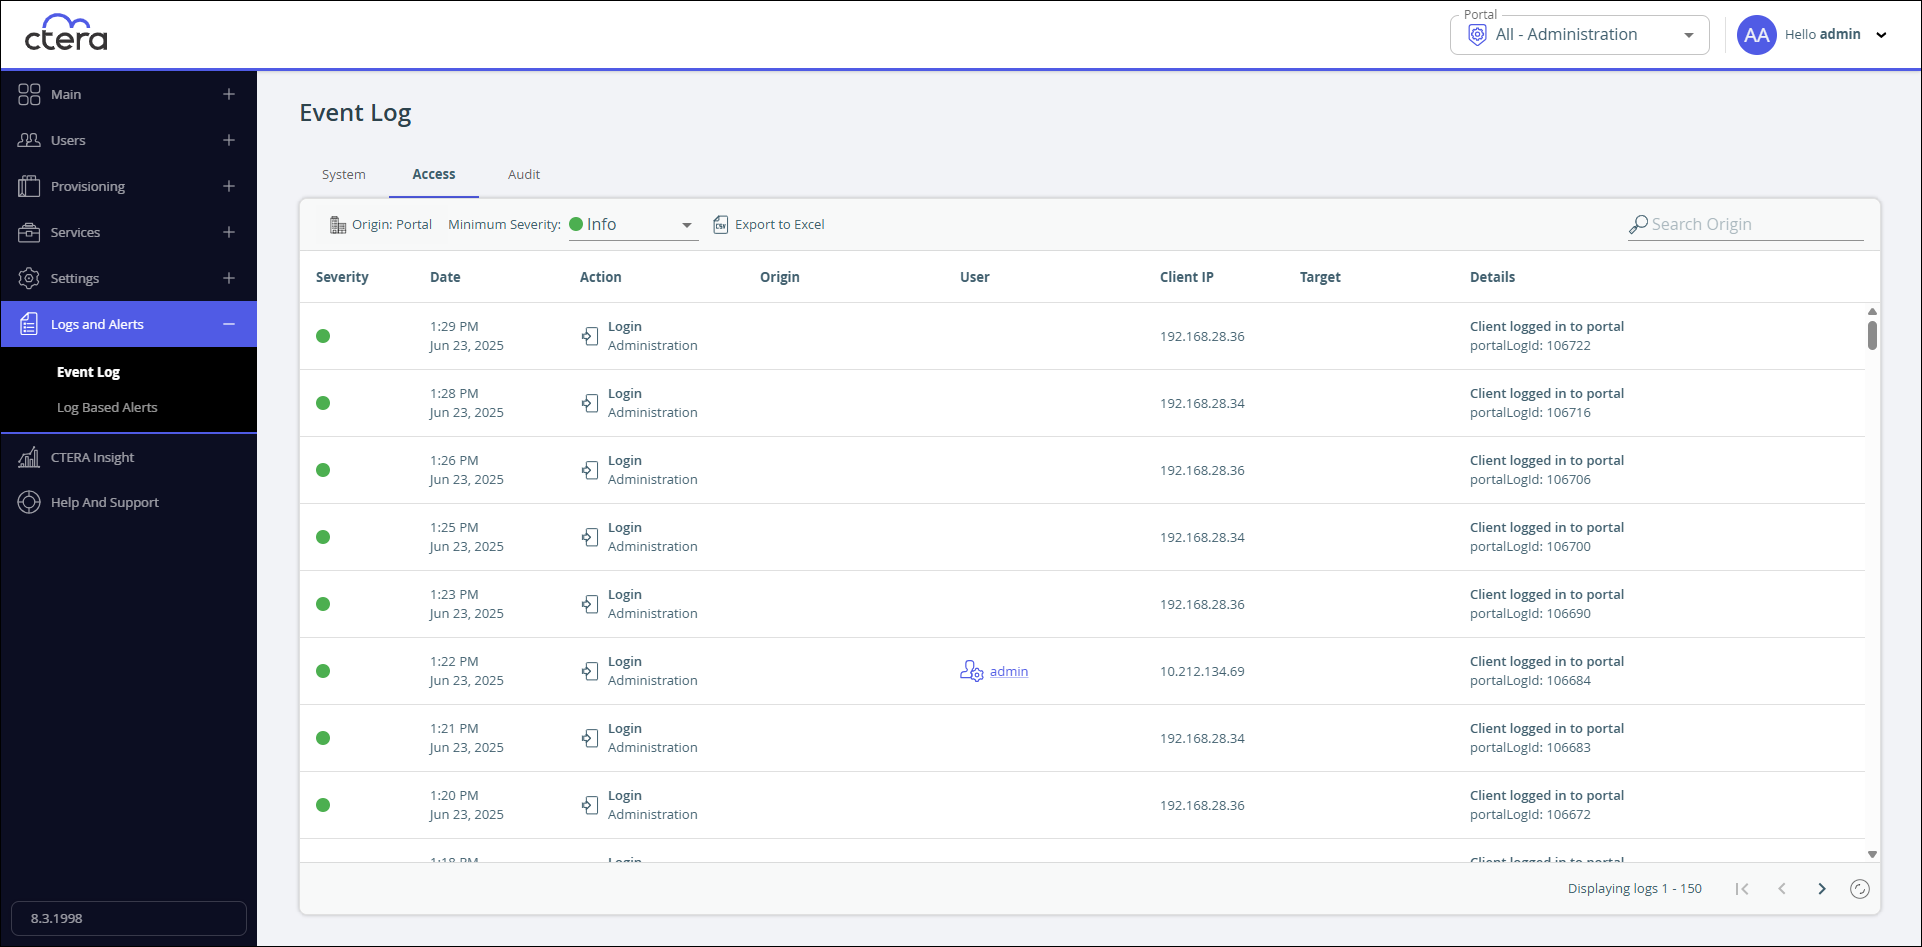
The Access Log
To view the access log:
- In the global administration view, select Logs and Alerts > Event Log in the navigation pane.
The Event Log page opens, displaying the system log. - Click the Access tab.

The page includes the following columns:
| Field | Display |
|---|---|
| Severity | The severity of the event represented by an icon. Green for OK, orange for warning and red for error. |
| Date | The date and time at which the event occurred. |
| Action | The action performed. |
| Origin | The entity that sent the log entry. |
| User | The user who triggered the event. If the user is an external user, without a portal account, added as a collaborator with an email address, the email address of the user is displayed. To view details about the user, if the user is not an external user, click the user name. |
| Client IP | The IP address from which the user triggered the event. |
| Target | The entity on which the action was performed. |
| Details | A description of the event. |
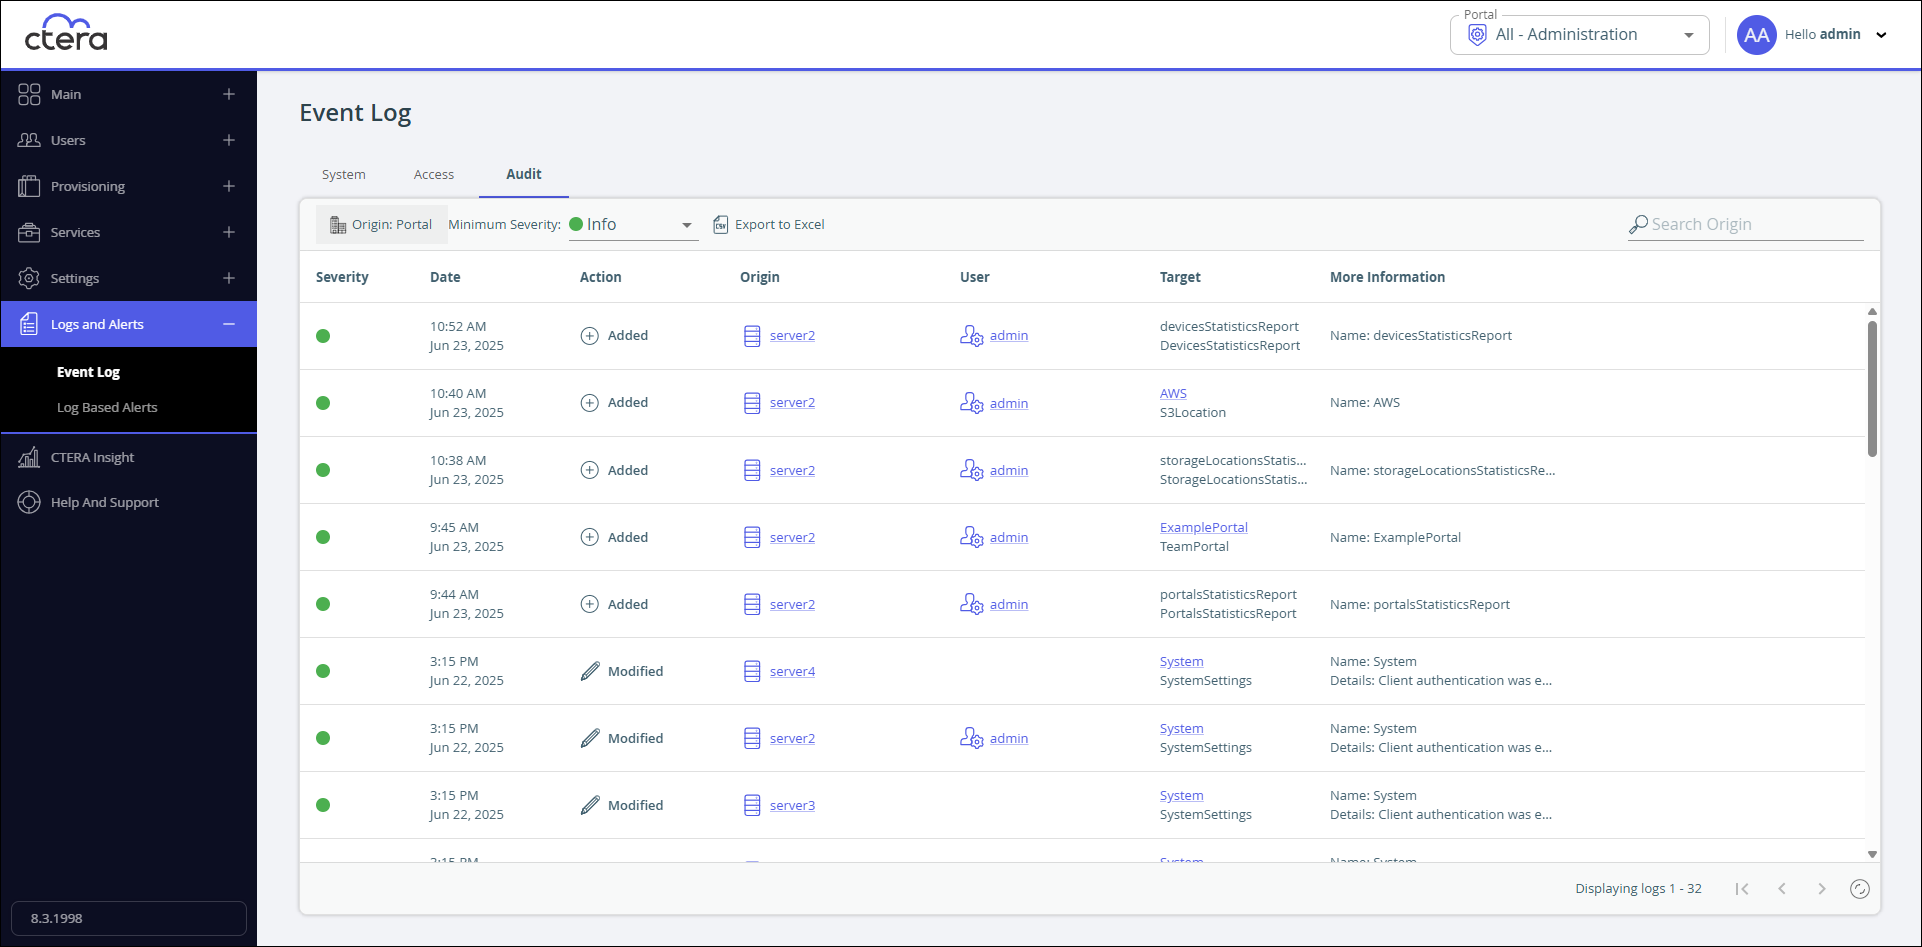
The Audit Log
To view the audit log:
- In the global administration view, select Logs and Alerts > Event Log in the navigation pane.
The Event Log page opens, displaying the system log. - Click the Audit tab.

The page includes the following columns:
| Field | Display |
|---|---|
| Severity | The severity of the event represented by an icon. Green for OK, orange for warning and red for error. |
| Date | The date and time at which the event occurred. |
| Action | The action performed: Added, Modified, or Deleted. |
| Origin | The entity that sent the log entry. To view details about the entity, click the entity name. |
| User | The user who triggered the event. If the user is an external user, without a portal account, added as a collaborator with an email address, the email address of the user is displayed. To view details about the user, if the user is not an external user, click the user name. |
| Target | The entity that was affected by the action. For example, a folder group or subscription plan, or user. When available, to view details about the entity, click the entity name. |
| More Information | Additional information about the event. |