To view a log file in the user interface:
- Select Logs and Alert > Event Log in the navigation pane.
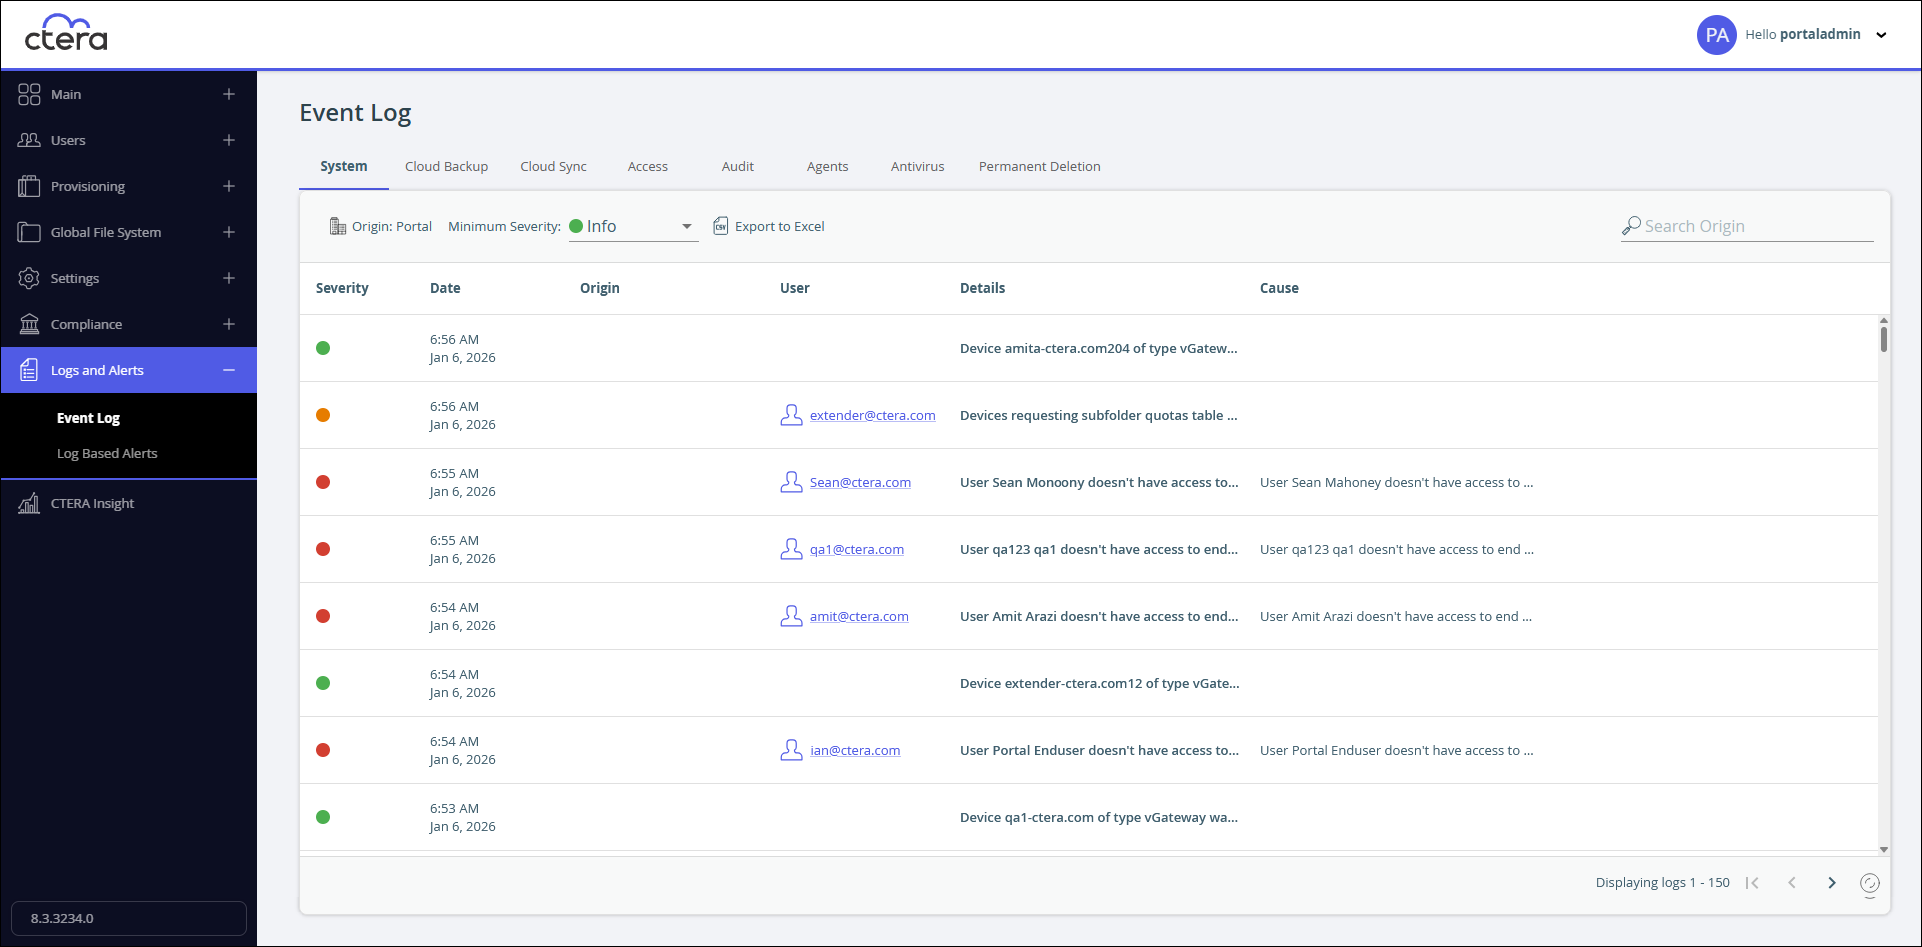
The Event Log page opens, displaying the System log.
- Select the log to view.
The following logs are available:
System Log
The information in the system log can be filtered by:
- The log origin: Portal, Device or All (both portals and devices).
- The minimum severity: Debug, Info, Warning, or Error.
The System Log page includes the following columns:
| Field | Display |
|---|---|
| Severity | The severity of the event represented by an icon. Green for OK, orange for warning and red for error. |
| Date | The date and time at which the event occurred. |
| Origin | The entity that sent the log entry. To view details about the entity, click the entity name. |
| User | The user who triggered the event. |
| Details | A description of the event. |
| Cause | A possible cause for the entry. |
Cloud Backup Log
The information in the cloud backup log can be filtered by:
- The minimum severity: Debug, Info, Warning, or Error.
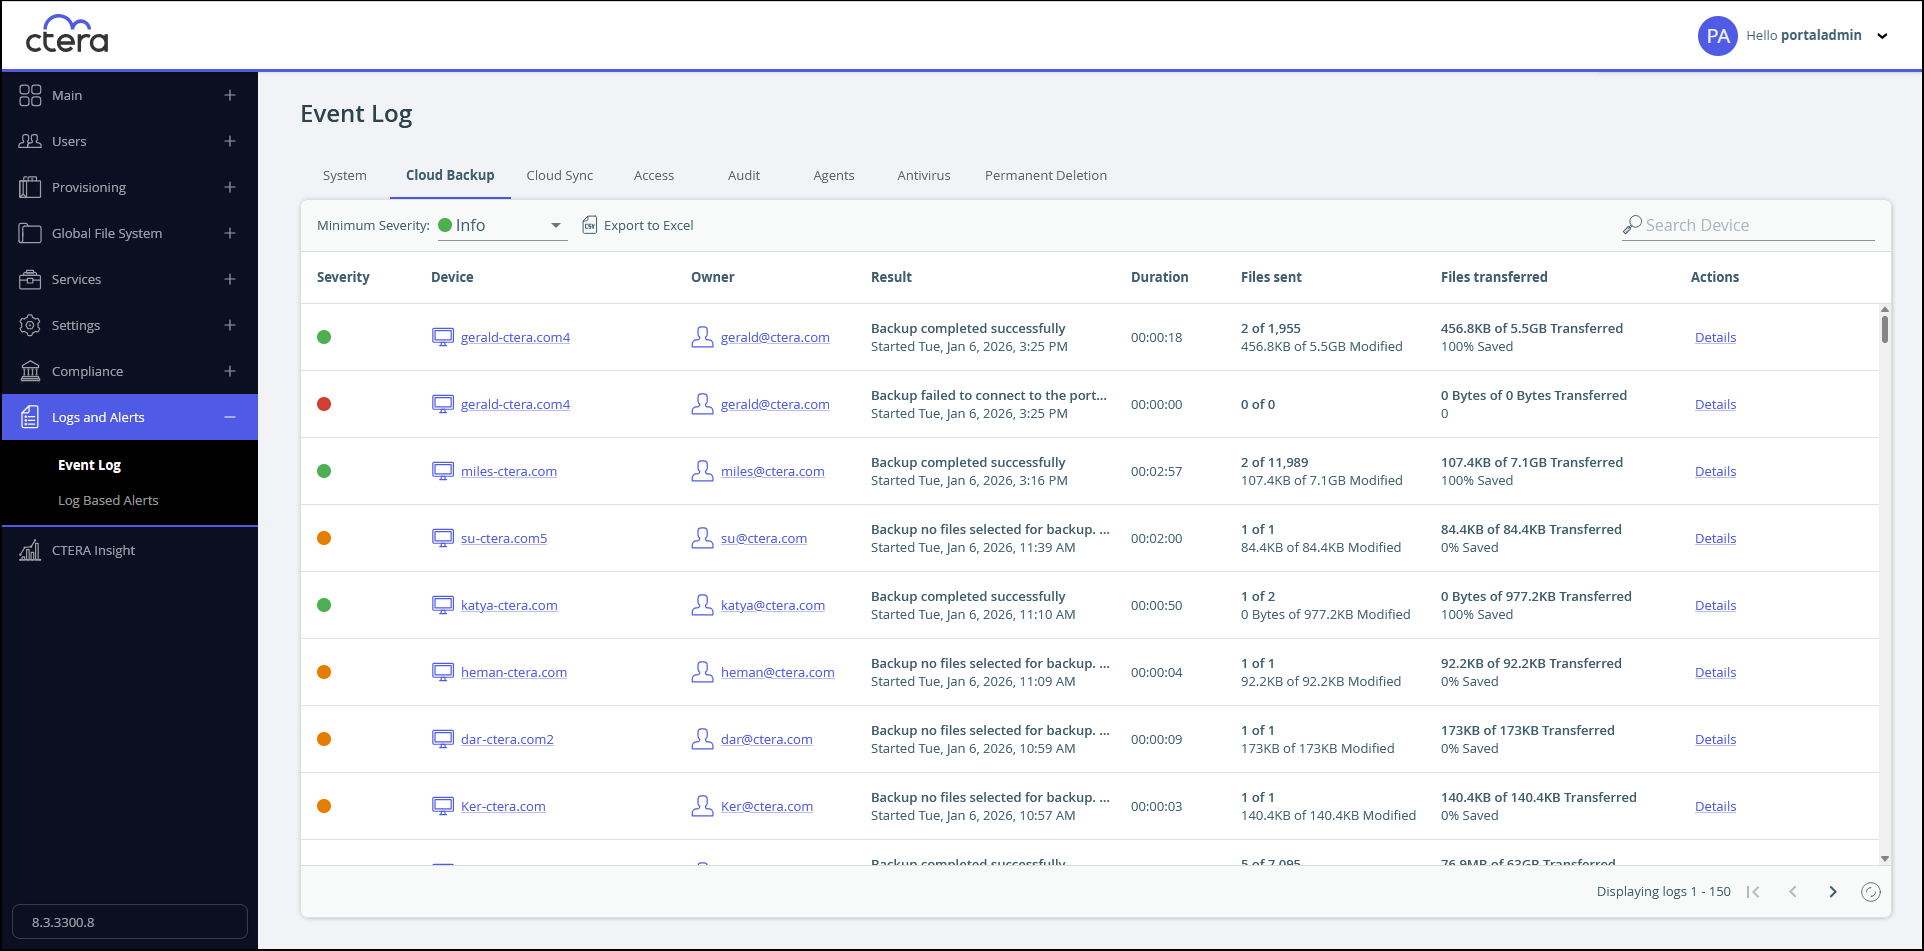
The Cloud Backup Log page includes the following columns:
| Field | Display |
|---|---|
| Severity | The severity of the event represented by an icon. Green for OK, orange for warning and red for error. |
| Device | The device name. |
| Owner | The user who triggered the backup. |
| Result | The result of the backup. |
| Duration | The time taken for the backup. |
| Files Sent | The files sent to the backup. |
| Files Transferred | The files transferred to the backup. |
| Actions | The actions performed. Clicking on Details displays the list of files backed up, including the file path and name. |
Cloud Sync Log
The information in the cloud sync log can be filtered by:
- The minimum severity: Debug, Info, Warning, or Error.
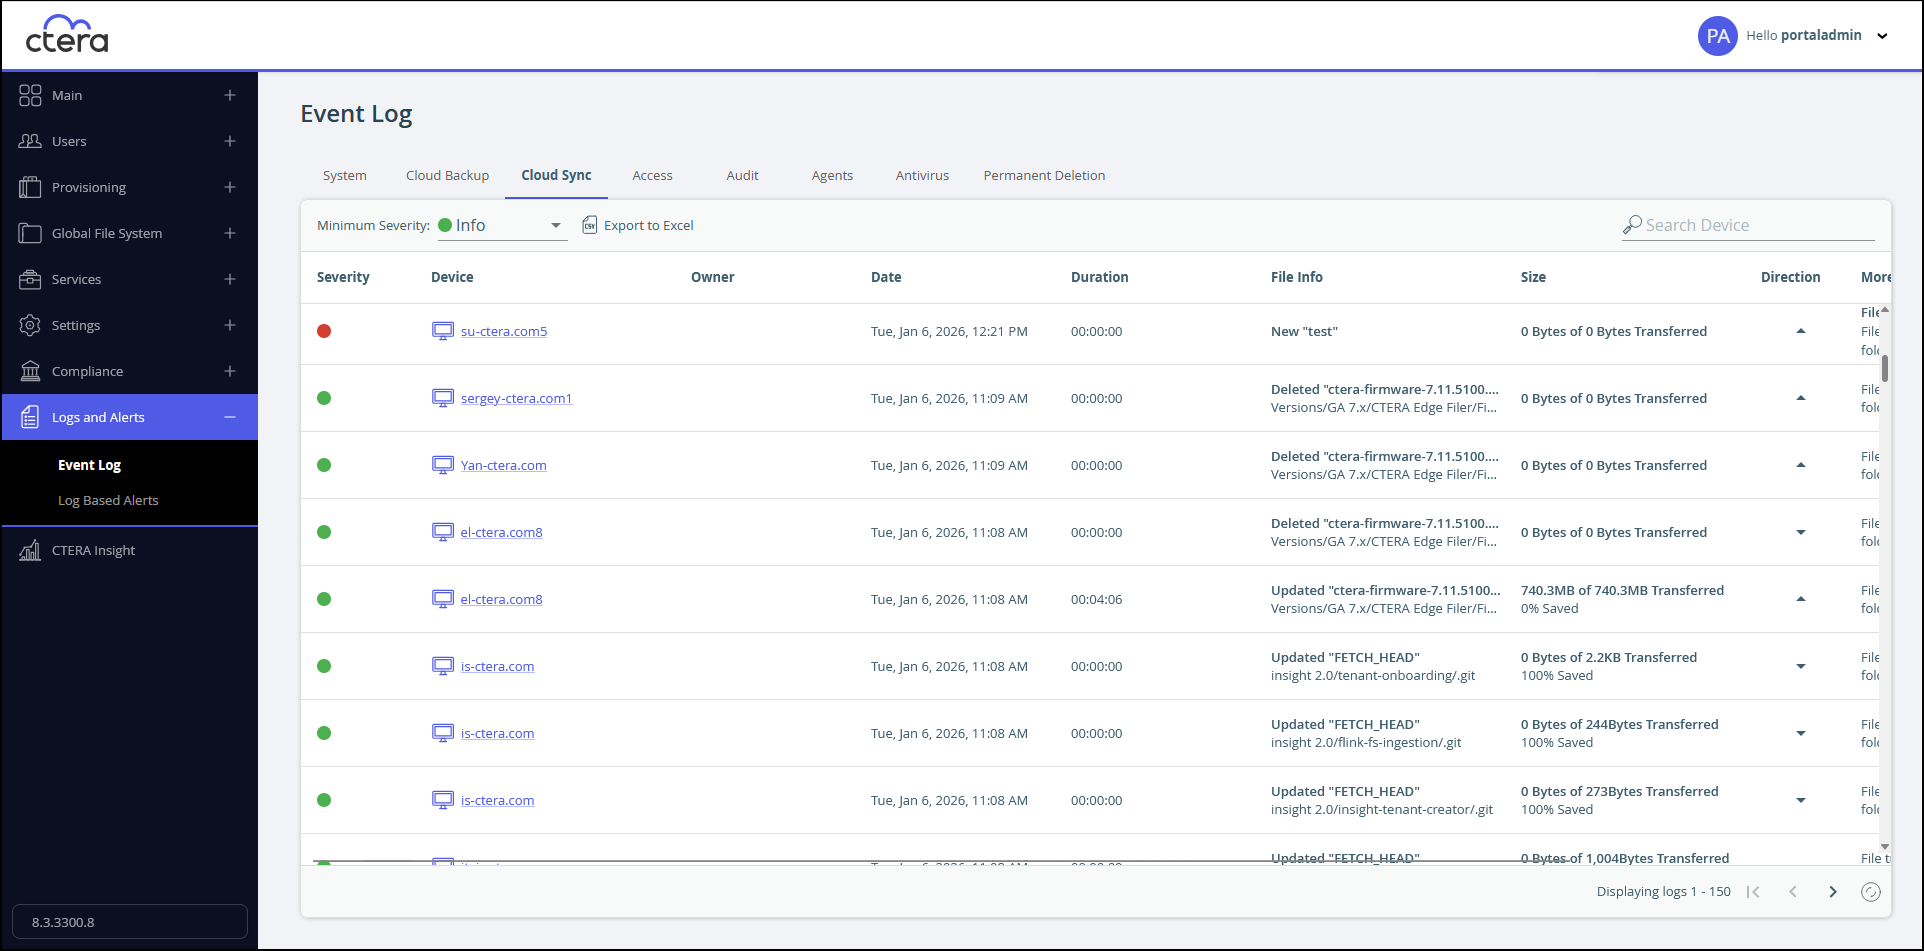
The Cloud Sync Log page includes the following columns:
| Field | Display |
|---|---|
| Severity | The severity of the event represented by an icon. Green for OK, orange for warning and red for error. |
| Device | The device name. |
| Owner | The user who triggered the sync. |
| Date | The date and time at which the event occurred. |
| Duration | The time taken for the sync. |
| File Info | Information about the change, such as new or updated. |
| Size | The number of bytes transferred. |
| Direction | The sync direction |
| More Info | Additional information. |
Access Log
The information in the access log can be filtered by:
- The log origin: Portal, Device or All (both portals and devices).
- The minimum severity: Debug, Info, Warning, or Error.
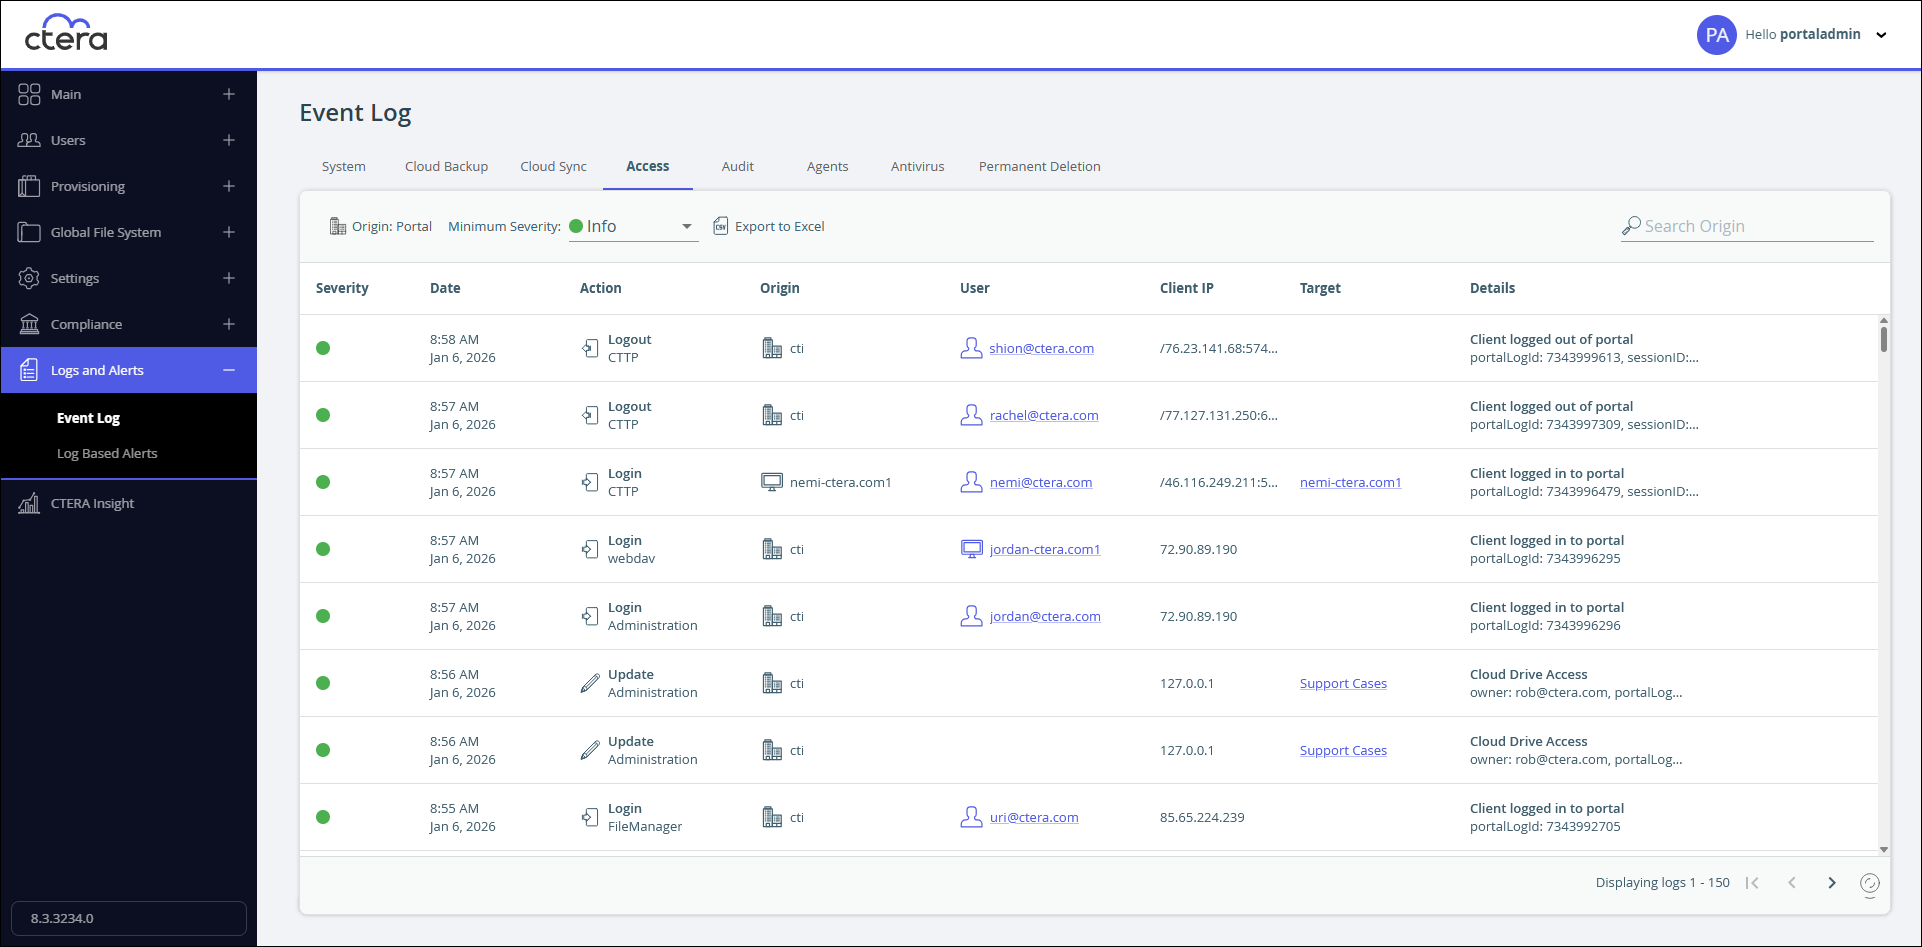
The Access Log page includes the following columns:
| Field | Display |
|---|---|
| Severity | The severity of the event represented by an icon. Green for OK, orange for warning and red for error. |
| Date | The date and time at which the event occurred. |
| Action | The action performed. |
| Origin | The entity that sent the log entry. |
| User | The user who triggered the event. If the user is an external user, without a portal account, added as a collaborator with an email address, the email address of the user is displayed. |
| Client IP | The IP address from which the user triggered the event. |
| Target | The entity on which the action was performed. |
| Details | A description of the event. For example, the user logged out and a file was shared for collaboration. |
Audit Log
The information in the audit log can be filtered by:
- The log origin: Portals, Devices or All (both portals and devices).
- The minimum severity: Debug, Info, Warning, or Error.
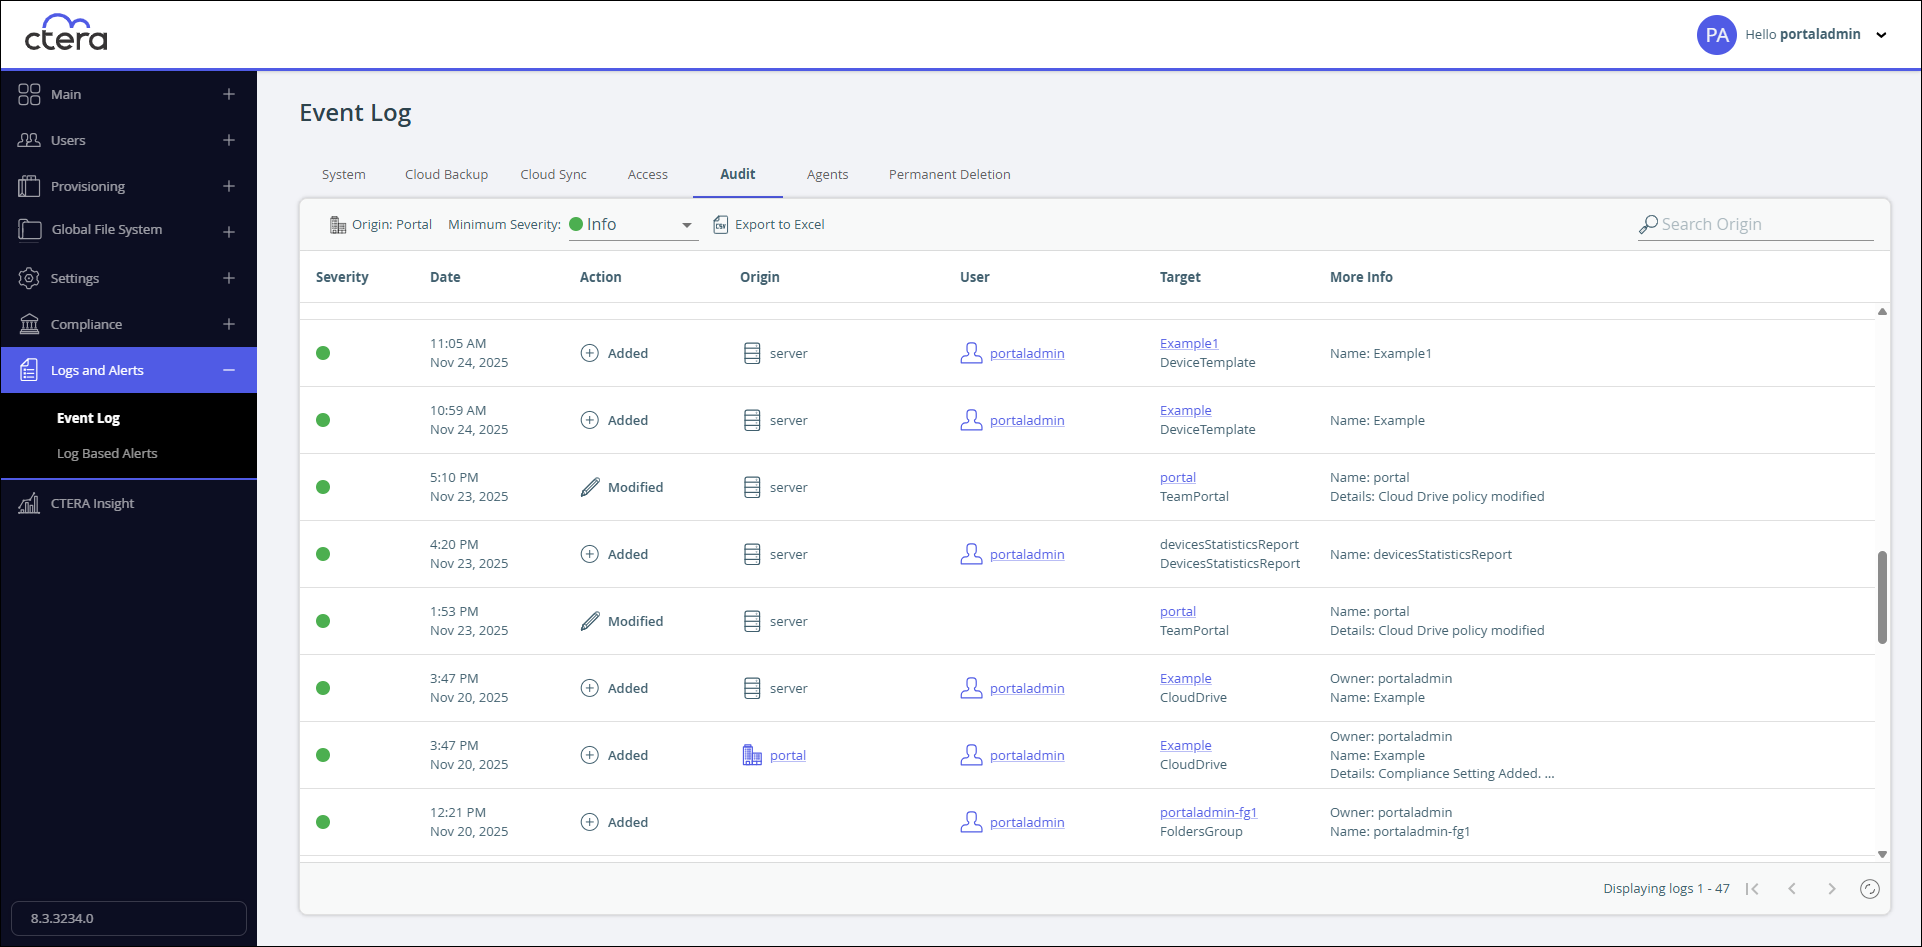
The Audit Log page includes the following columns:
| Field | Display |
|---|---|
| Severity | The severity of the event represented by an icon. Green for OK, orange for warning and red for error. |
| Date | The date and time at which the event occurred. |
| Action | The action performed: Added, Modified or Deleted. |
| Origin | The entity that sent the log entry. |
| User | The user who triggered the event. |
| Target | The entity that was affected by the action. For example, a folder group or subscription plan, or user. To view details about the entity, click the entity name. |
| More Info | Additional information about the event. |
Agents Log
The information in the agents log can be filtered by:
- The minimum severity: Debug, Info, Warning, or Error.
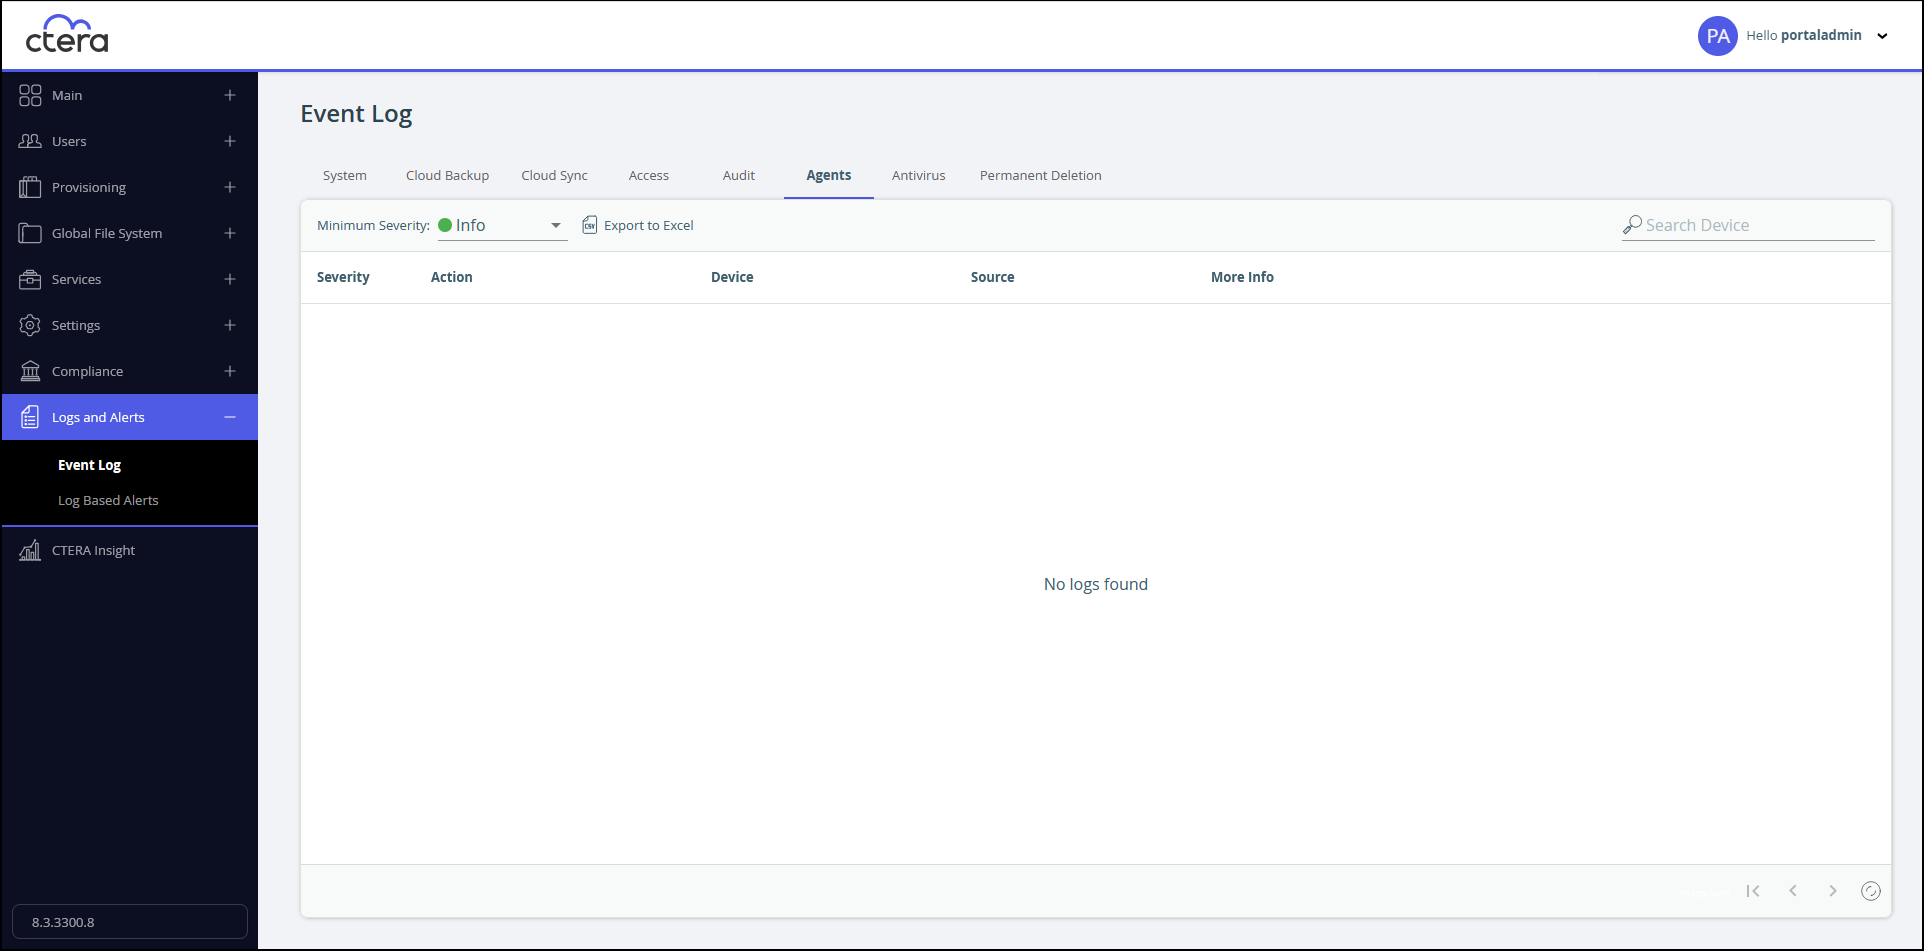
The Agents Log page includes the following columns:
| Field | Display |
|---|---|
| Severity | The severity of the event represented by an icon. Green for OK, orange for warning and red for error. |
| Action | The action performed. |
| Device | The device name. To view details about the device, click the device name. The device details are displayed in a new browser window. |
| Source | The user. |
| More Info | Additional information about the event. For example, an agent version was changed. |
Antivirus Log
The Antivirus log is only available if the portal is licensed for antivirus and the subscription plan includes the antivirus option.

The information in the antivirus log can be filtered by:
- The minimum severity: Debug, Info, Warning, or Error.
The Antivirus Log page includes the following columns:
| Field | Display |
|---|---|
| Severity | The severity of the event represented by an icon. Green for OK, orange for warning and red for error. |
| Action | The action performed. |
| File Name | The name of the file moved to quarantine as a potential threat. |
| Uploader | The user who uploaded the file to the portal. |
| Threat | The threat description. |
Permanent Deletion Log
The information in the permanent deletion log can be filtered by:
- The minimum severity: Debug, Info, Warning, or Error.
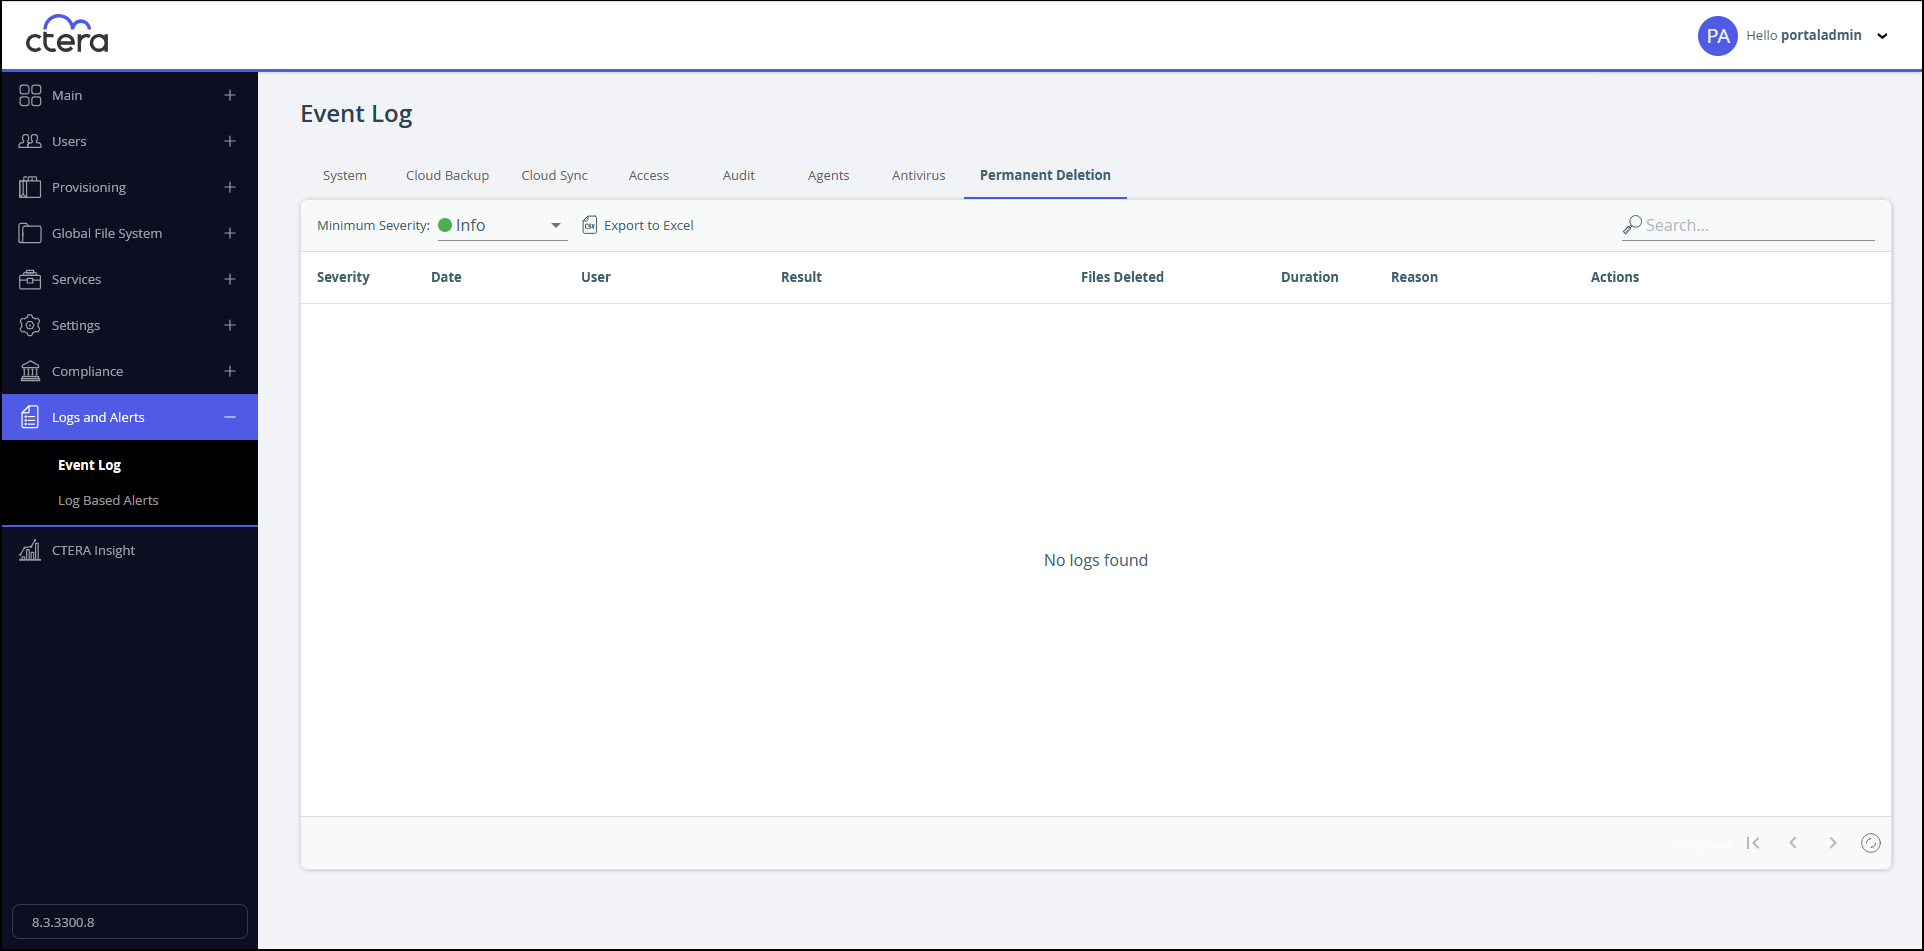
The Permanent Deletion Log page includes the following columns:
| Field | Display |
|---|---|
| Severity | The severity of the event represented by an icon. Green for OK, orange for warning and red for error. |
| Date | The date and time at which the event occurred. |
| User | The user who triggered the deletion. |
| Result | The result of the deletion, whether successful or not. |
| Files Deleted | The files that were permanently deleted. |
| Duration | The time taken to permanently delete the items. |
| Reason | The reason for the deletion that was entered in the Permanent Deletion Wizard in the Verification step. |
| Actions | The actions performed. Clicking on Details displays the list of files deleted, with the file path and name and snapshot, last modified and more information about the deleted file. |